
LINK / USD Price Analysis: Breaking Chains
Chainlink has bullish signals all around as fundamental news finds fertile technical ground.
- Chainlink is bullish in the short-term, with the LINK / USD pair testing towards the current 2019 trading high
- A bullish inverted head and shoulders pattern has formed across the four-hour time frame
- The daily time frame is showing that the cryptocurrency is testing towards major trendline resistance
Chainlink / USD Short-term price analysis
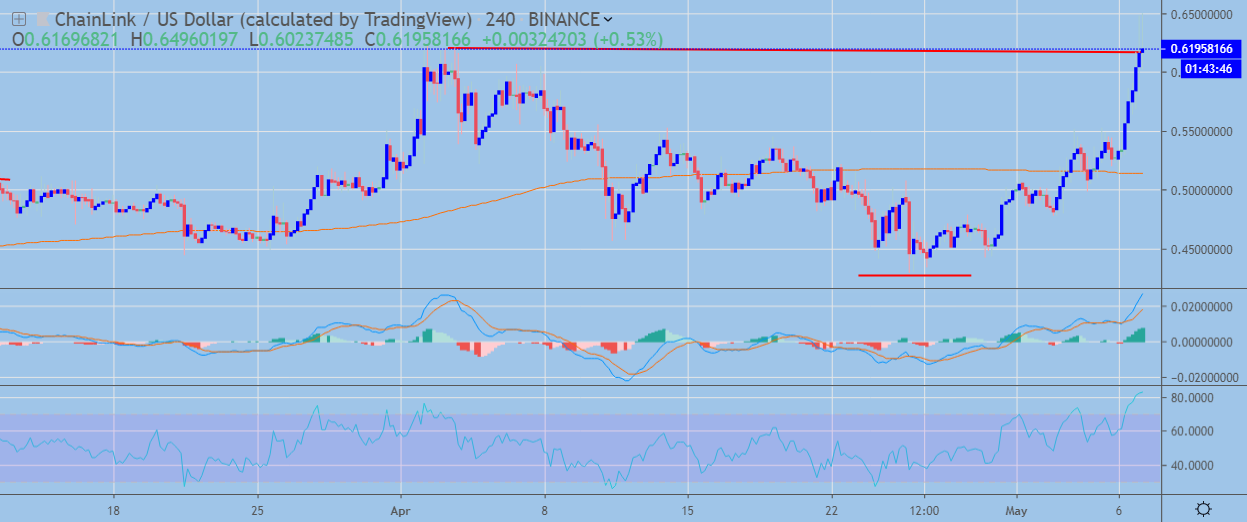
Chainlink has a bullish short-term trading outlook, with the cryptocurrency testing towards the best levels of the year so far.
The four-hour time frame is showing that a large inverted head and shoulders pattern has formed, with buyers currently testing towards the neckline of the bullish pattern.
Technical indicators on the four-hour time frame have turned bullish and continue to issue a strong buy signal.
 LINK / USD H4 Chart by TradingView
Pattern Watch
Traders should note that the upside objective of the inverted head and shoulders pattern on the four-hour time frame will take the LINK / USD pair towards the November 19th, 2018 trading high.
Relative Strength Index
The RSI indicator on the four-hour time frame is bullish, although it has reached overbought conditions.
MACD Indicator
The MACD indicator on the four-hour time frame is bullish and is currently generating a buy signal.
Fundamental Analysis
LINK’s price spike was likely triggered by Ethereum’s bullish momentum. Chainlink is attempting to solve the problem of providing Oracles for Ethereum. In fact, it might be the project that’s closest to a solution, making it very important for the wider ecosystem.
Chainlink / USD Medium-term price analysis
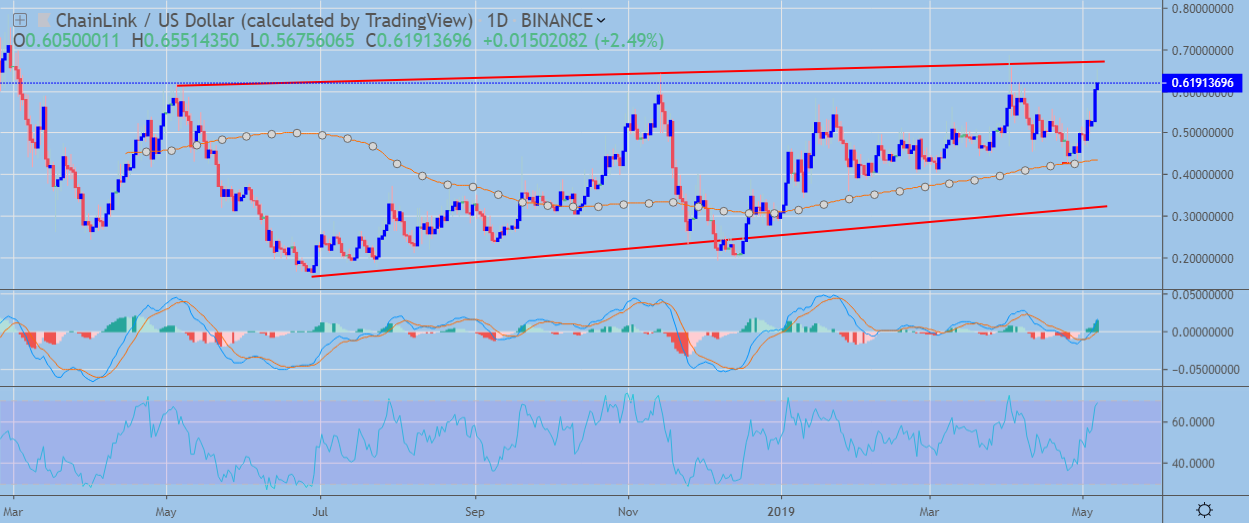
The LINK / USD pair has a bullish medium-term trading outlook, with the cryptocurrency testing towards major trendline resistance on the daily time frame.
The daily time frame is showing that a bearish head and shoulders pattern has been invalidated, with a much larger inverted head and shoulders pattern now emerging.
Technical indicators on the daily time frame have turned bullish and continue to issue a strong buy signal.
 LINK / USD Daily Chart by TradingView
Pattern Watch
Traders should note that if trendline resistance is broken on the daily time frame the LINK / USD pair could rally towards the January 21st, 2018 trading high.
Relative Strength Index
The RSI indicator on the daily time frame has turned bullish and is generating a strong buy signal.
MACD indicator
The MACD indicator on the daily time frame is bullish, with both the MACD signal line and MACD histogram issuing a buy signal.
Fundamental Analysis
From the fundamental perspective the project also looks bullish. It has a strong technical team and currently faces little in terms of public competition.
Conclusion
Chainlink is growing increasingly bullish over both time horizons, with the cryptocurrency now approaching major technical resistance.
If buyers can break through upcoming trendline resistance on the daily time frame the LINK / USD pair could soar in value, while failure to surpass upcoming resistance could prompt a wave of technical selling.
Check out our coin guide for Chainlink to understand more about Oracles.