
OMG / USD Price Analysis: Depressive State
OmiseGo has seen little action, and though some indicators remain positive, the future looks bleak.
- OmiseGo is bearish in the short-term, with the cryptocurrency still trading below its 200-period moving average on the four-hour time frame
- The medium-term outlook for OmiseGo is bearish, with the cryptocurrency unable to move above its 200-day moving average
- A larger inverted head and shoulders pattern still remains valid on the daily time frame
OmiseGo / USD Short-term price analysis
OmiseGo is bearish in the short-term, with the cryptocurrency trading well below its 200-period moving average on the four-hour time frame.
The four-hour time frame is showing that multiple head and shoulders patterns have taken shape following the latest decline in the OMG / USD pair.
Technical indicators on the four-hour time frame have turned bullish as the OMG / USD pair attempts to recover.
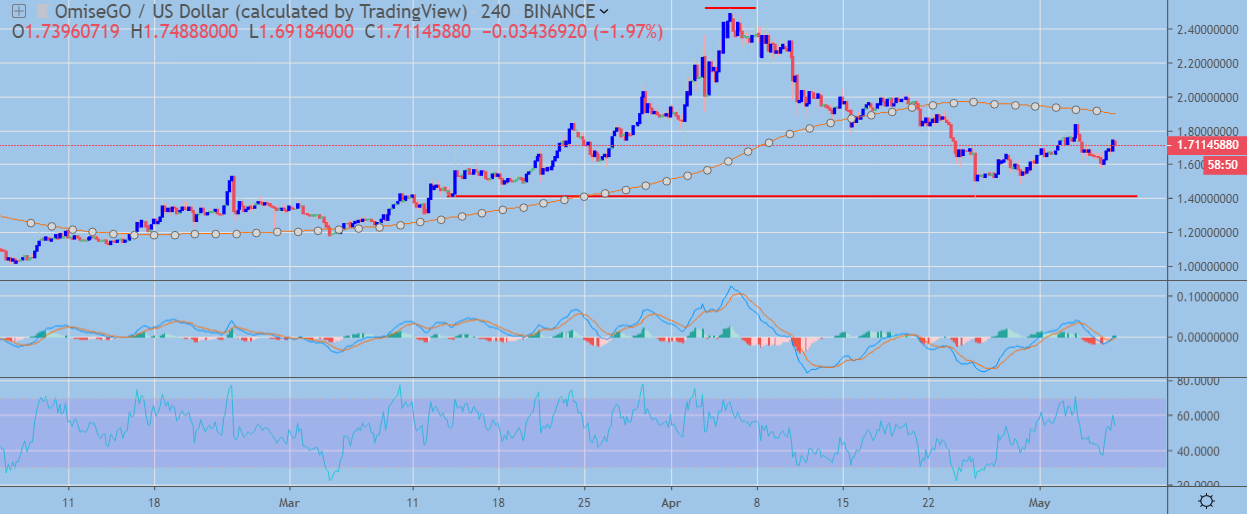 OMG / USD H4 Chart by TradingView
Pattern Watch
Traders should note that the current 2019 trading low is the downside objective of the smaller head and shoulders pattern.
Relative Strength Index
The RSI indicator on the four-hour time frame has turned bullish and continues to generate a buy signal.
MACD Indicator
The MACD indicator on the four-hour time frame is attempting to turn bullish.
OmiseGo / USD Medium-term price analysis
OmiseGo has a bearish medium-term trading outlook, with the cryptocurrency still unable to move above its 200-day moving average.
The daily time frame continues to show a valid inverted head and shoulders pattern, although buyers are struggling to move price above the neckline of the bullish pattern.
Technical indicators on the daily time frame are neutral and failing to generate a clear trading signal.
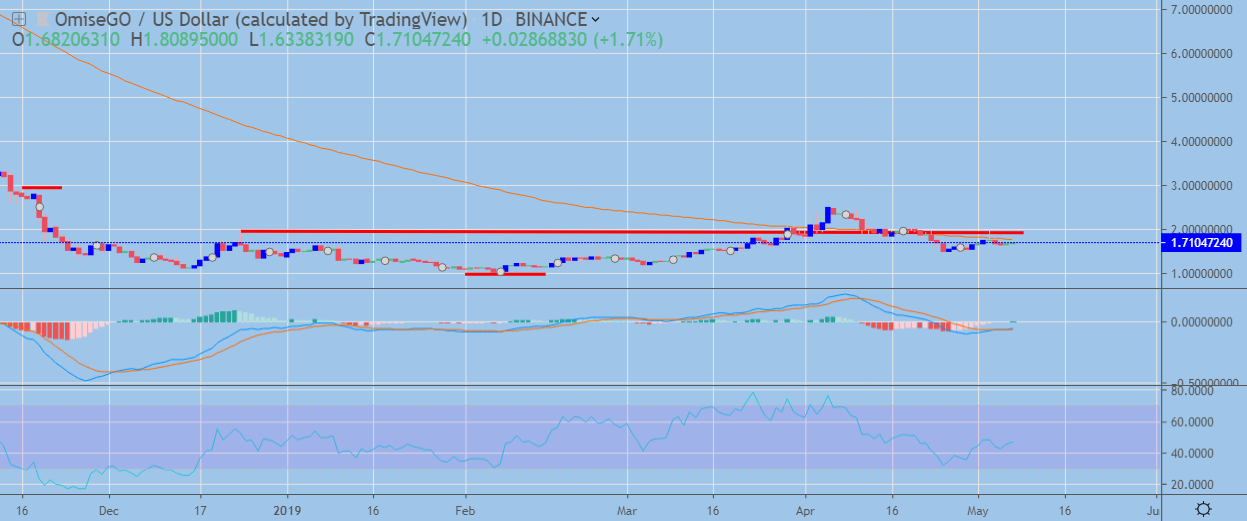 OMG / USD Daily Chart by TradingView
Pattern Watch
Traders should note that the overall target of the bullish pattern on the daily time frame would take the OMG / USD pair towards the November 15th trading high.
Relative Strength Index
The RSI indicator is rising on the daily time frame, although it has failed to turn bullish so far.
MACD Indicator
The MACD indicator is neutral on the daily time frame and is failing to generate a clear trading signal.
Conclusion
OmiseGo is struggling to turn bullish across both time horizons despite the recent upside recovery in the cryptocurrency and the bullish pattern on the daily time frame.
If buyers fail to rally the OMG / USD pair higher in the short-term, the bearish patterns present on the four-hour time frame may soon start to come into play.
Check out our coin guide for OmiseGo.