
Pundi X Price Analysis NPXS / USD: Uptown Breakout
Pundi X is aiming for November highs as it threatens technical breakout.
- Pundi X has a bullish short-term trading bias, with the NPXS / USD pair trading well above its 200-period moving average
- The four-hour time frame shows that bulls are trying to invalidate a bearish head and shoulders pattern
- Buyers are once again attempting a major bullish breakout on the daily time frame
Pundi X / USD Short-term price analysis
Pundi X has a bullish short-term trading outlook, with the cryptocurrency trading well above its 200-period moving average on the four-hour time frame.
The four-hour time frame continues to show a head and shoulders pattern, with NPXS / USD bulls now attempting to invalidate the bearish pattern.
Technical indicators across the four-hour time frame are bullish and show scope for further upside.
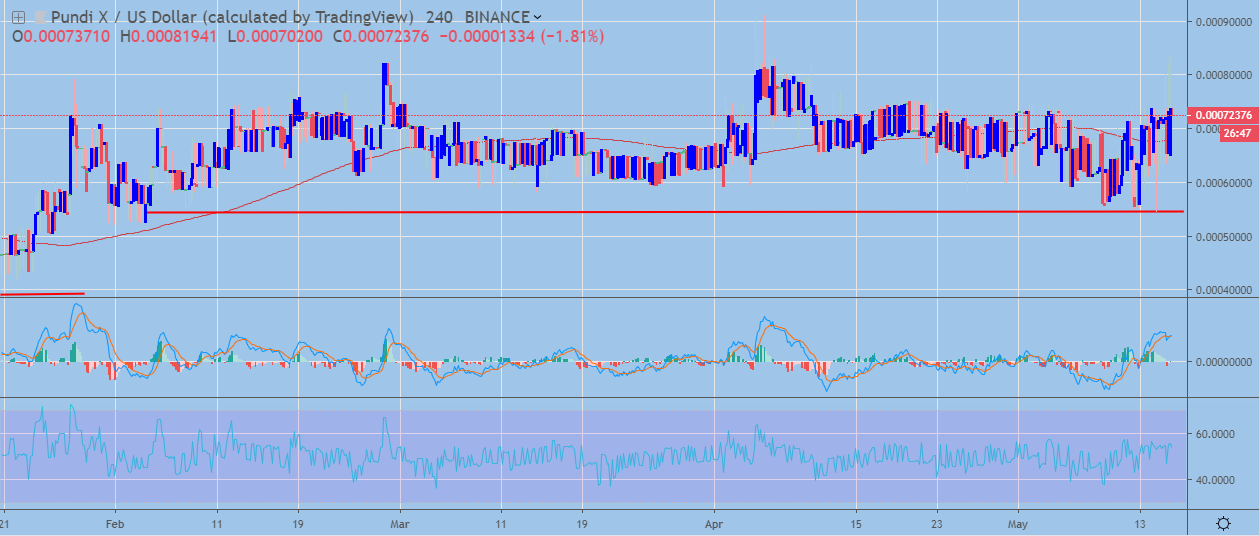 NPXS / USD H4 Chart by TradingView
Pattern Watch
Traders should note that the NPXS / USD pair will need to rally to a new 2019 trading high in order to invalidate the head and shoulders pattern on the four-hour time frame.
Relative Strength Index
The RSI indicator is turning higher on the four-hour time frame and shows scope for further upside.
MACD Indicator
The MACD indicator is bullish on four-hour time frame, although the MACD histogram is currently lagging behind the recent up move in the NPXS / USD pair.
Pundi X / USD Medium-term price analysis
Pundi X has an increasingly bullish medium-term outlook, with the cryptocurrency attempting to break above its key 200-day moving average.
The daily time frame is showing that the NPXS / USD pair is trading towards the neckline of a large inverted head and shoulders pattern with a sizeable upside projection.
Technical indicators on the daily time frame are bullish and show scope for further upside.
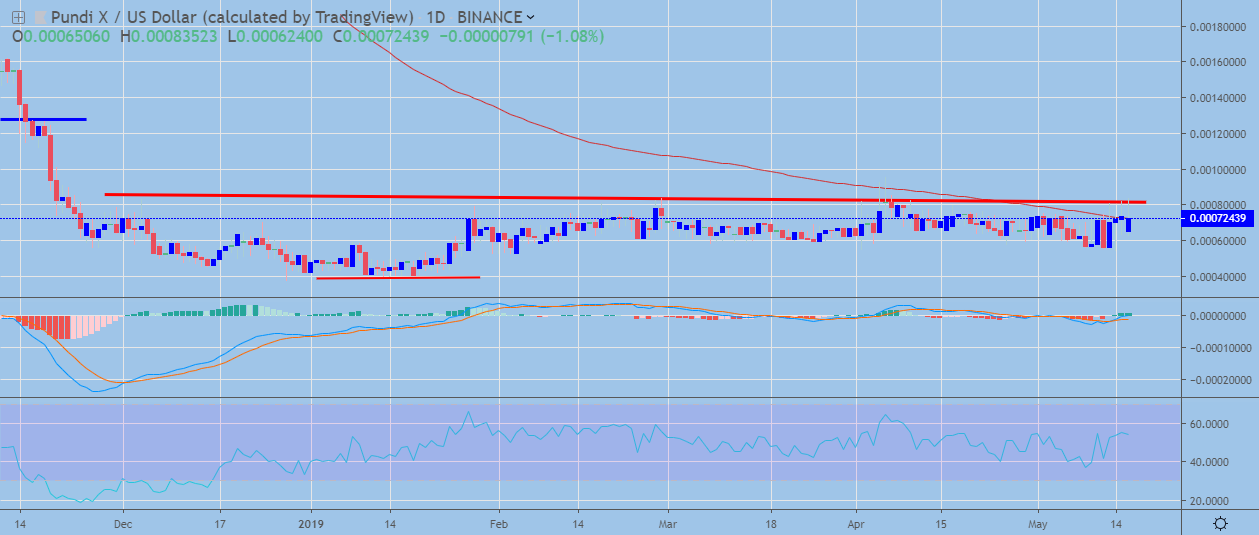 NPXS / USD Daily Chart by TradingView
Pattern Watch
Traders should note that the November 13th, 2018 swing high is the initial target of the large inverted head and shoulders on the daily time frame.
Relative Strength Index
The RSI indicator has turned bullish on the daily time frame and shows scope for further upside.
MACD Indicator
The MACD indicator on the daily time frame is bullish, with both the MACD signal line and histogram issuing buy signals.
Conclusion
Pundi X is once again threatening a major technical breakout, with the short-term bulls now needing to invalidate the bearish pattern on the four-hour time frame.
If buyers can finally ignite the large bullish pattern on the daily time frame, the NPXS / USD pair could move into a new bullish phase over the medium-term horizon.
Check out our coin guide for Pundi X for a quick glance at the project.