
Ripple Price Analysis XRP / USD: Actually Buying The News
Ripple buys a stake in MoneyGram, triggering a rally.
- Ripple has a bullish short-term trading bias, with the cryptocurrency still holding above its 200-period moving average on the four-hour time frame
- The four-hour time frame shows a bearish head and shoulders pattern
- The daily time frame continues to highlight that a confirmed technical breakout is still underway
Fundamental Analysis
Ripple gained bullish moment after the project announced a strategic partnership with MoneyGram, one of the world’s largest money transfer companies. Under the terms of the deal, Ripple will invest up to $50 mln and acquire an 8% to 10% stake in MoneyGram. The partnership should provide an opportunity to make a case for xRapid, which directly utilizes XRP for cross-border transaction payments.
Ripple / USD Short-term price analysis
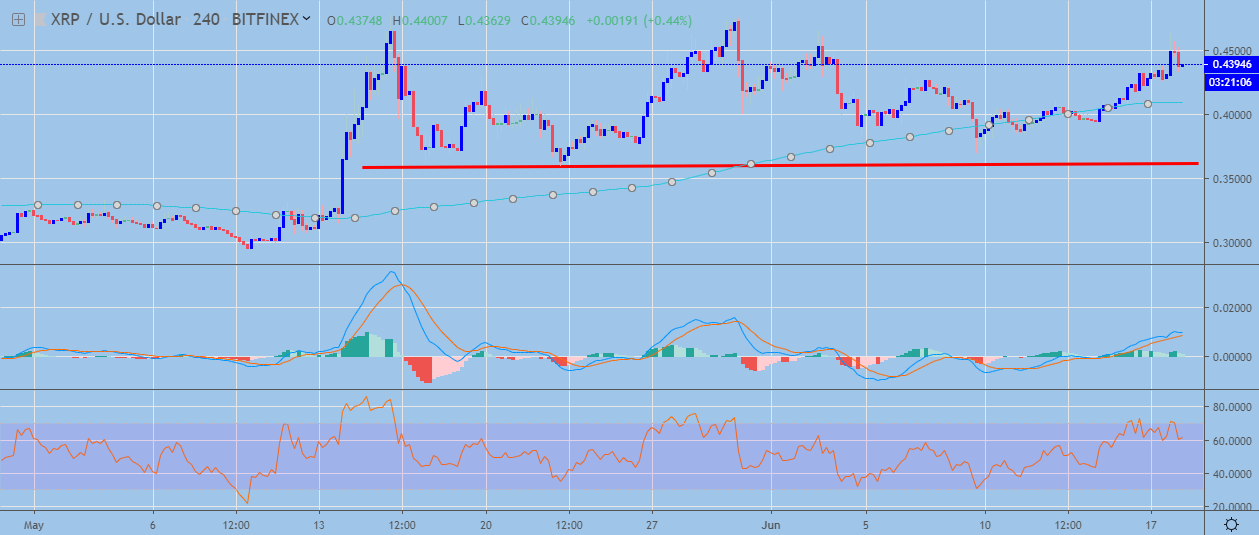
Ripple has a bullish short-term outlook, with the XRP / USD pair still holding price above its 200-period moving average on the four-hour time frame.
The four-hour time frame is showing that a bearish head and shoulders pattern has now emerged after XRP / USD bulls repeatedly failed to breach May’s monthly trading high.
Technical indicators across the four-hour time frame are mixed and are failing to generate a clear trading signal.
Pattern Watch
Traders should note that a sustained move under the $0.3650 level could trigger a $0.1000 move lower in the XRP / USD pair.
Relative Strength Index
The RSI indicator is bullish on the four-hour time frame, although it is now starting to correct lower.
MACD Indicator
The MACD indicator is mixed on the four-hour time frame, with the MACD signal line still offering a buy signal, while the MACD histogram continues to trend lower.
Ripple / USD Medium-term price analysis
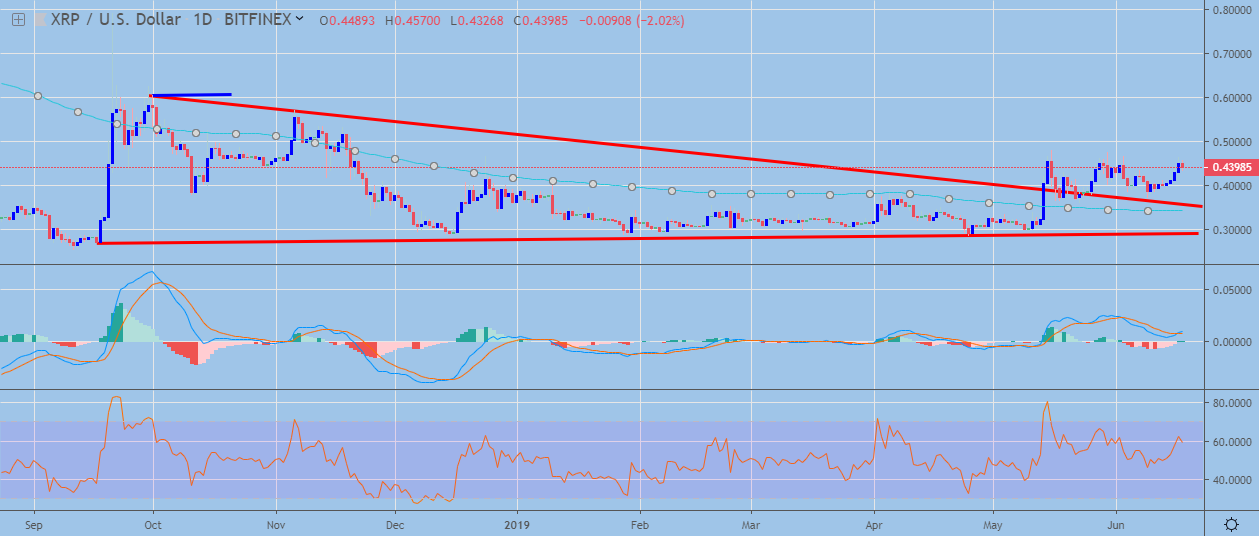
Ripple has a bullish medium-term outlook, with the XRP/USD pair still trading at elevated levels above major technical support.
The daily time frame is showing that the bullish technical breakout in the XRP/USD pair still remains valid, despite the recent loss of upside momentum.
Indicators on the daily time frame are also mixed and are currently failing to generate a clear trading signal.
Pattern Watch
Traders should note that critical technical support on the daily time frame is located at the $0.3600 and $0.3450 levels.
Relative Strength Index
The Relative Strength indicator on the daily time frame remains bullish, although upside momentum is waning.
MACD Indicator
The MACD indicator on the daily time frame is conflicted, with the MACD signal line turning bearish while the MACD histogram is rising.
Conclusion
Ripple has reached a crossroads in the short-term, with XRP/USD pair increasingly at risk of a bearish correction back towards the $0.2600 level if the May 2019 is unable to be broken.
The medium-term prospects for the XRP/USD pair still appear healthy while bulls hold price above major trendline support on the daily time frame.
Find out more about Ripple in our coin guide.
A deeper look into the merits of the project can be found in our DARE.