
Shutterstock cover by Zenik
Solana Is Edging Closer to a Breakout
Solana appears to have taken a hiatus after enjoying significant gains in September, but it could be approaching a breakout.
Solana has endured a lengthy consolidation period after posting a new all-time high of $216 in early September. Although SOL remains stagnant, the asset could be gearing up for a significant spike in volatility.
Solana Takes the Back Seat
Solana could be ready to break out.
The smart contract blockchain’s SOL token has been consolidating for several weeks. At the same time, many market participants have shifted their attention toward Bitcoin after the first BTC futures ETF launched in the U.S. today.
SOL has been making a series of lower highs and higher lows without providing a clear outlook of where it is heading next. Such price action appears to have developed a symmetrical triangle on SOL’s daily chart.
The measurement of the height of the triangle’s y-axis added to the breakout point suggests that the ongoing stagnation period could result in a 43% price movement. Still, Solana must first print a daily candlestick close above resistance or below support to determine the direction of its trend.
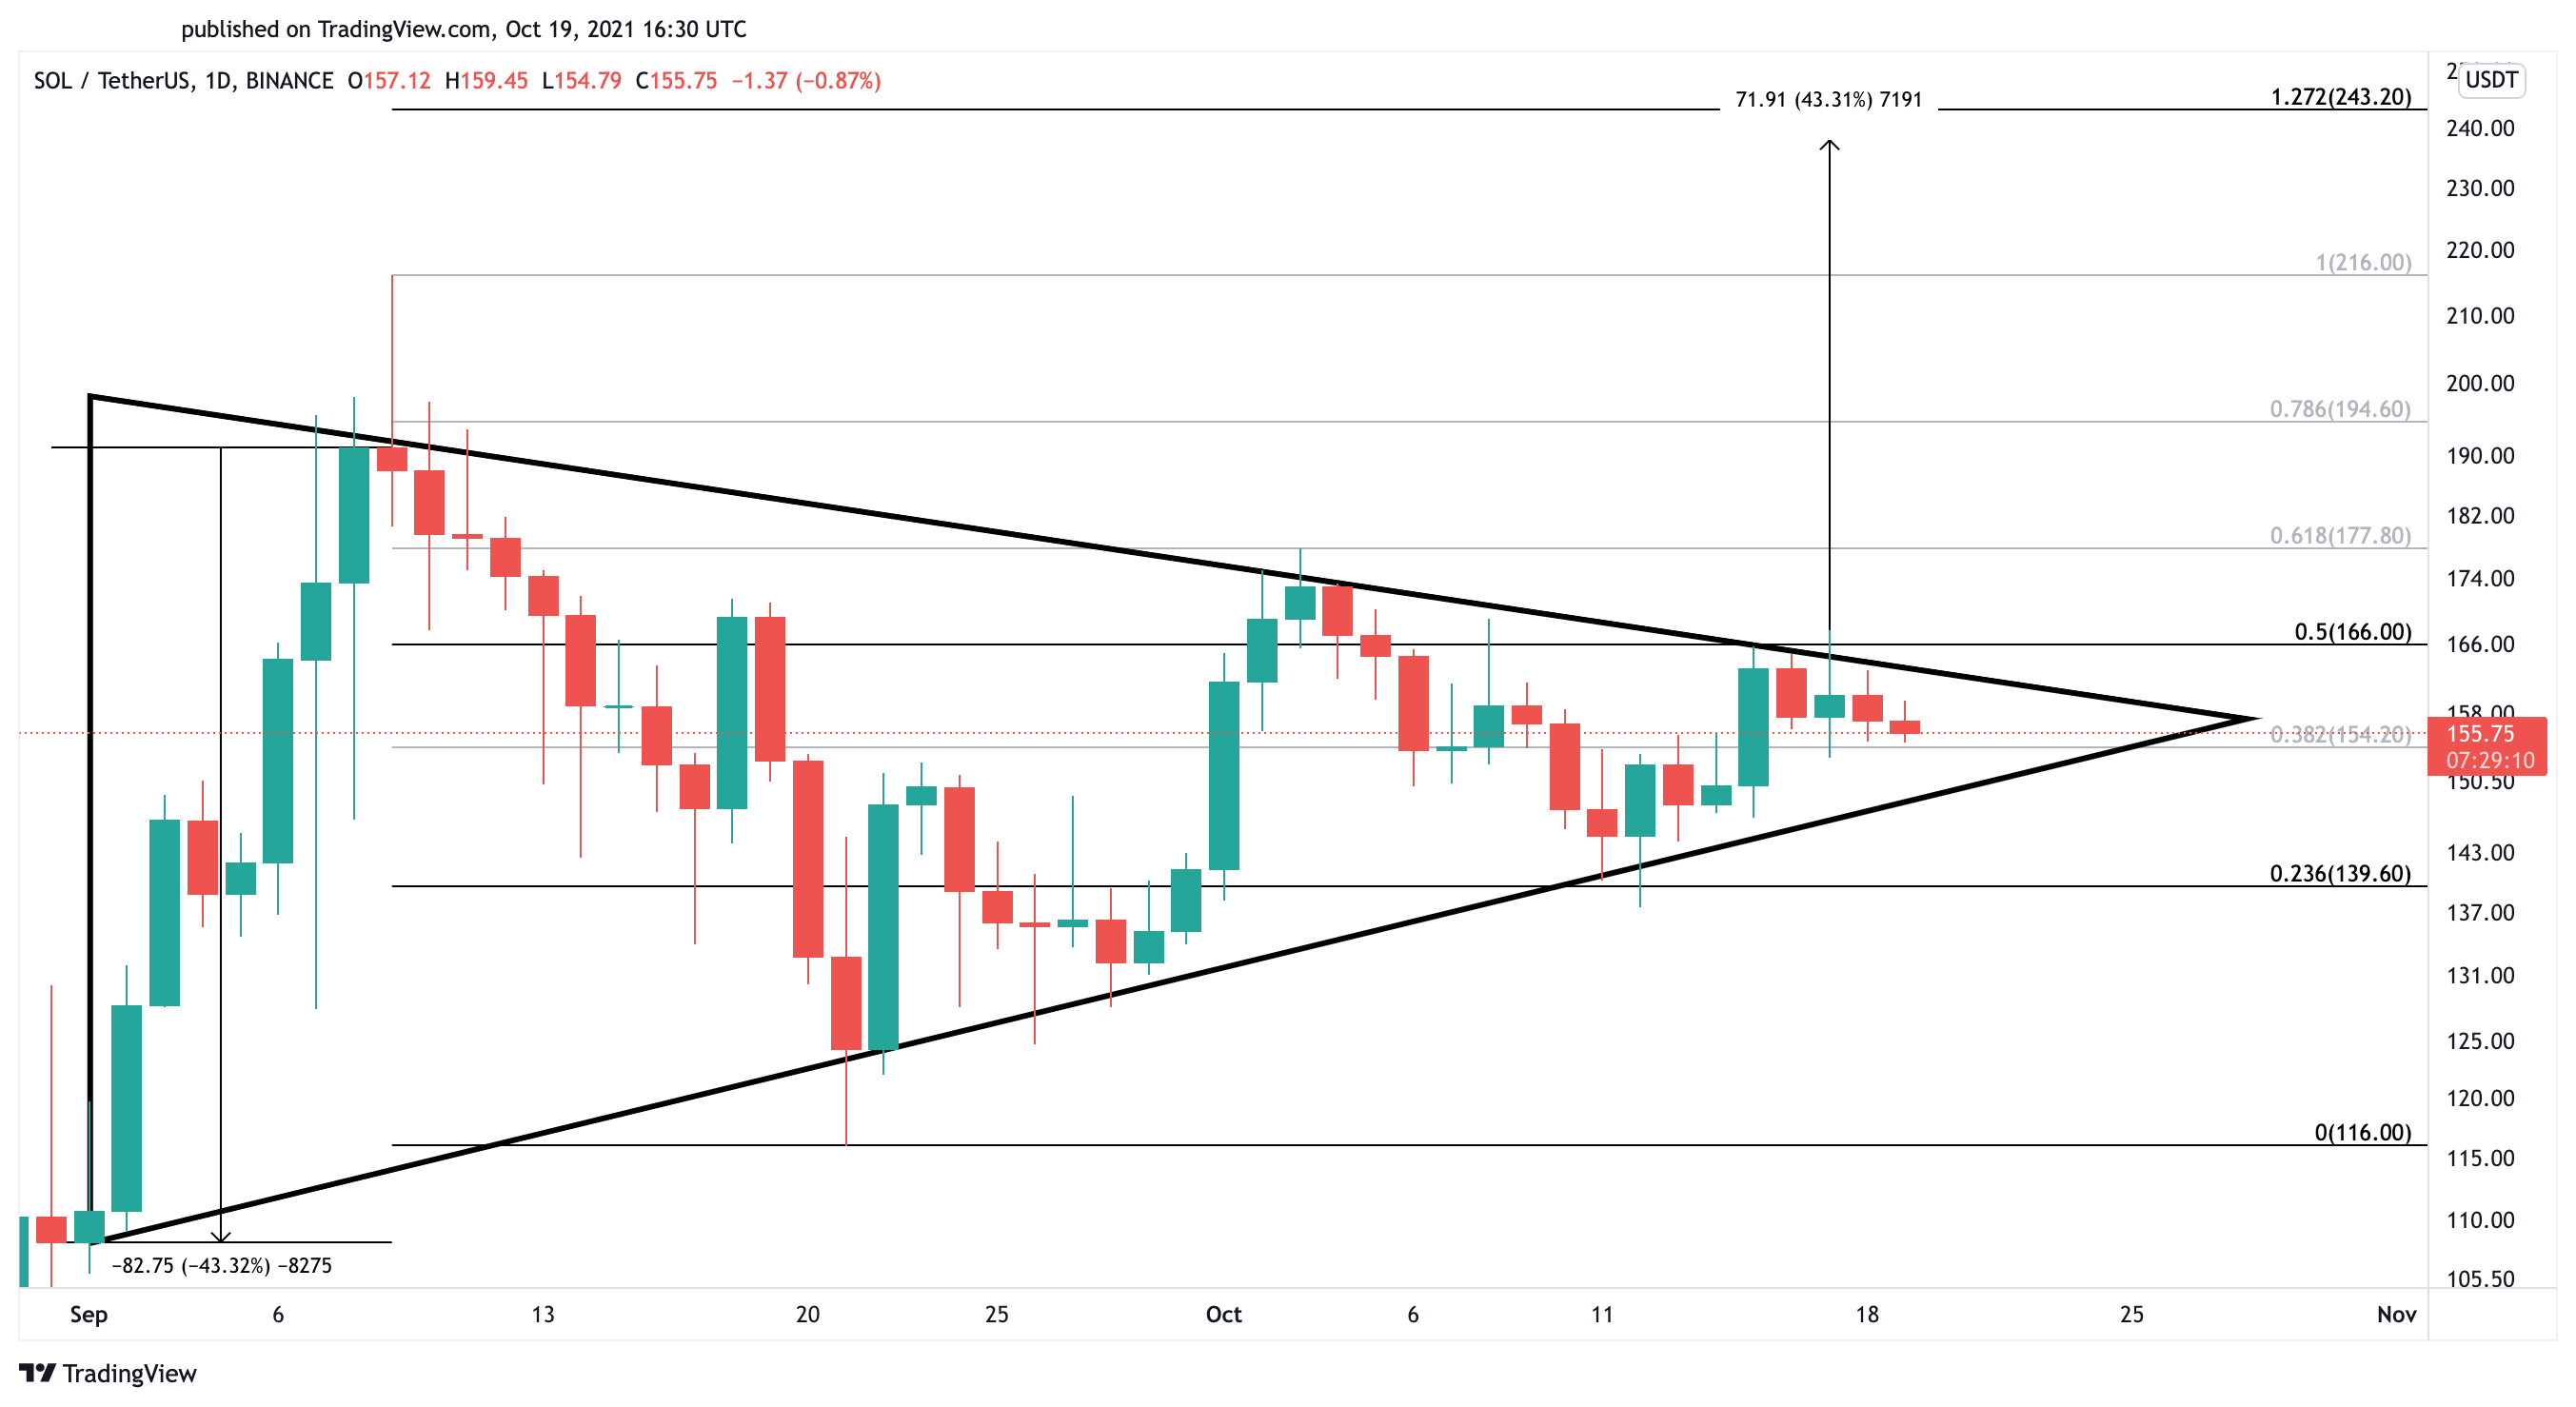
The Fibonacci retracement indicator, measured from the Sep. 9 all-time high at $216 to the Sep. 21 swing low at $116, suggests that the most crucial resistance barrier ahead of Solana sits at $166. Both the triangle’s upper trendline and the 50% Fibonacci retracement level lie around this price point.
Given its significance to reject any bullish impulse in the past few days, a decisive close above $166 could result in a breakout toward a new all-time high at $243.
Any sign of weakness that leads to a downswing below the 23.6% Fibonacci retracement level at $140 could invalidate the optimistic outlook. Under such unique circumstances, Solana could dive to retest the Sep. 21 swing low at $116.
Disclosure: At the time of writing, the author of this feature owned BTC and ETH.