
Stellar Lumen Price Analysis XLM / USD: Ignite The Upside
Stellar has rebounded from a false bearish breakout, but critical resistance has slowed gains.
- Stellar Lumen has a bullish short-term trading bias, with the cryptocurrency testing towards the April monthly high
- The four-hour time frame shows that bulls are attempting to invalidate a bearish head and shoulders pattern
- The daily time frame continues to show a large inverted head and shoulders pattern
Stellar Lumen / USD Short-term price analysis
Stellar Lumen has a bullish short-term outlook, with the cryptocurrency testing back towards the April monthly trading high.
The four-hour time frame is showing that XLM / USD bulls are attempting to invalidate a bearish head and shoulders pattern, following a false downside breakout.
Technical indicators are bullish on the four-hour time frame, although they are starting to appear overstretched.
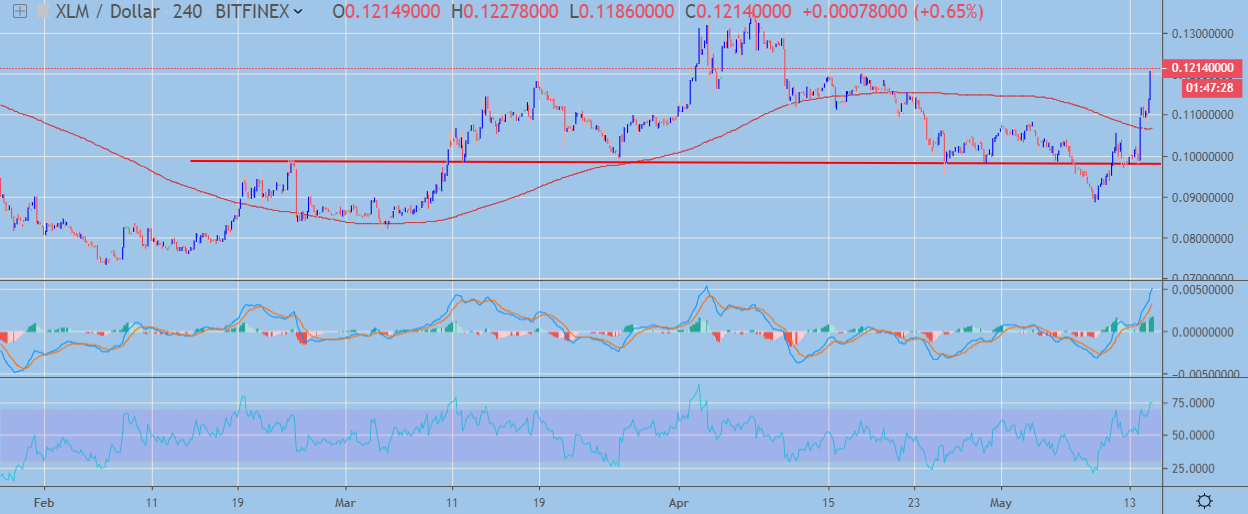 XLM / USD H4 Chart by TradingView
Pattern Watch
Traders should note that an inverted head and shoulders pattern could take shape if buyers invalidate the bearish pattern on the four-hour time frame.
Relative Strength Index
The RSI indicator is bullish on the four-hour time frame, although it is now trading in extremely overbought territory.
MACD Indicator
The MACD indicator is bullish on the four-hour time frame and is currently generating a strong buy signal.
Stellar Lumen / USD Medium-term price analysis
Stellar Lumen has a neutral medium-time outlook, with the XLM / USD pair recovering back towards its 200-day moving average.
The daily time frame shows that the inverted head and shoulders pattern is still valid, with the XLM / USD pair advancing close to the neckline of the large bullish pattern.
Technical indicators on the daily time frame have turned bullish and show scope for further upside.
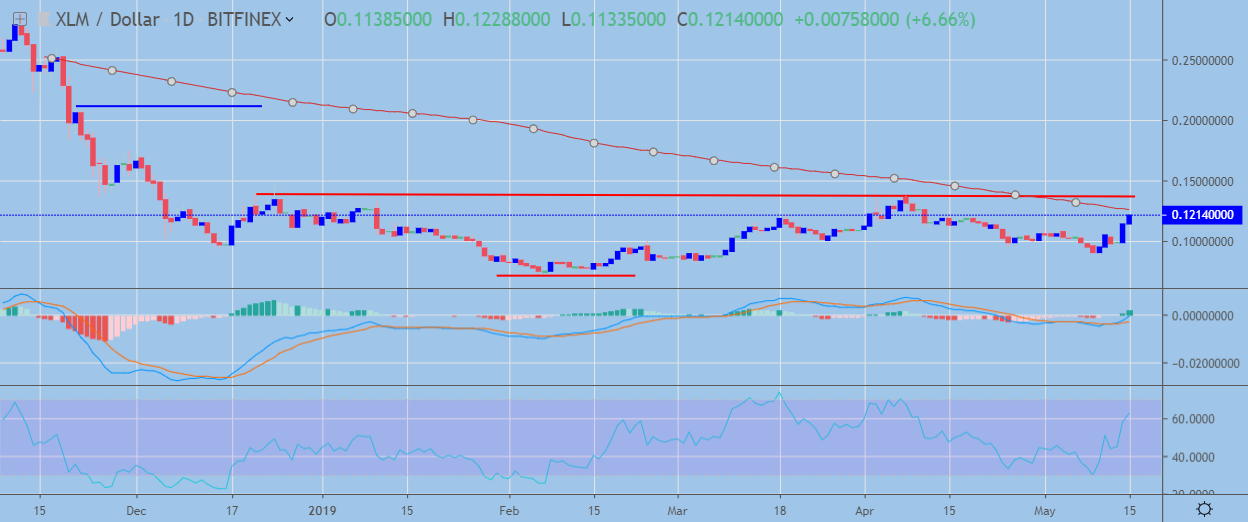 XLM / USD Daily Chart by TradingView
Pattern Watch
Traders should note that if the inverted head and shoulders pattern is triggered on the daily time frame, the November 22nd 2018 swing-high is the initial upside target.
Relative Strength Index
The RSI indicator has turned bullish on the daily time frame and shows scope for further upside.
MACD Indicator
The MACD indicator is bullish on the daily time frame and is currently issuing a strong buy signal.
Conclusion
Stellar Lumen has staged an impressive recovery in the short-term with price now approaching critical resistance on both time horizons.
XLM / USD buyers now need to invalidate the bearish pattern on the four-hour time frame and trigger the bullish pattern on the daily time frame to ignite the next upside rally in the cryptocurrency.
Check out our coin guide for XLM.
Our analyst team also covered Stellar, offering a deep look into the project.