
Technical Index Spells Trouble for Bitcoin, Ethereum, and XRP
Bitcoin, Ethereum, and XRP seem to have reached overbought territory following last week's price action. Still, different metrics suggest that the uptrend would likely resume after a correction.
The top three cryptocurrencies by market cap — Bitcoin, Ethereum, and XRP — made headlines after breaking out of a two-month-long stagnation period. While prices seem to be trading up, a widely known technical index estimates that a pullback is underway.
Bitcoin May Retrace Before Claiming New Yearly Highs
Following a downward trend for nearly two months, Bitcoin is back in the green.
The flagship cryptocurrency appears to have broken out of a bullish pennant on Jul. 21. Since then, its price has done nothing but shoot up, allowing it to turn the infamous $10,000 resistance level into support.
BTC recently reached a high of over $10,340, representing a 12.70% upswing over the past week.
Although the pennant estimated a target of $10,640, the recent peak could be considered an exhaustion point.
Indeed, the Tom Demark (TD) sequential indicator presented two different sell signals on BTC’s 1-day chart. The bearish formations developed in the form of a green nine and combo 13 candlestick. A spike in the selling pressure behind the pioneer cryptocurrency could validate the pessimistic outlook.
If so, the TD setup estimates that Bitcoin may pull back for one to four daily candlesticks before the uptrend resumes.
Based on the Fibonacci retracement indicator, Bitcoin could drop to $9,780 or $9,600 to provide sidelined investors an opportunity to get back into the market.
A new influx of capital around this price level would likely help the bellwether cryptocurrency march towards new yearly highs.
It is worth noting that a sudden increase in demand for Bitcoin might have the strength to invalidate the sell signals presented by the TD index.
If this were to happen, a green two candlestick trading above a preceding green one candle on the daily chart could serve as confirmation that BTC is poised for further advance.
Ethereum Shows Signs of Exhaustion
Ethereum stole the crypto spotlight after its impressive price action during the past week.
Data from CoinMarketCap reveals that over $10 billion were injected into the smart contracts giant between Jul. 20 and Jul. 27. The significant capital inflow allowed Ether to break out of a two-month consolidation phase and surpass mid-February’s high of $289.
Moving past this hurdle appears to have triggered FOMO among market participants who rushed to exchanges to get a piece of the price action.
The considerable demand for Ethereum allowed it to appreciate further and reach a new yearly high of nearly $330.
Now, the TD sequential indicator suggests that Ethereum is sitting in overbought territory and could be bound for a steep correction. This technical index presented a sell signal in the form of a green nine candlestick on the 1-day chart.
Ether could see its price drop to the 23.6% or 38.2% Fibonacci retracement levels if the bearish formation is validated. These critical support barriers sit at $300 and $260, respectively.
The Fibonacci retracement indicator also shows that there isn’t any barrier ahead of ETH that will prevent it from surging to late June 2019’s high of over $360.
Although the TD highlights the potential for a pullback, traders must be aware of the weak resistance ahead. Thus, if ETH rises above the recent high $330, it would likely advance further.
XRP Breaks Above Key Resistance Barrier
Ripple’s XRP has finally broken above its 200-day moving average for the first time since February.
Since then, this resistance barrier had been rejecting any upward price action preventing the cross-border remittances token from achieving its upside potential.
Now that this crucial hurdle is serving as support, the odds for XRP to rise towards mid-February’s high of nearly $0.35 increased exponentially.
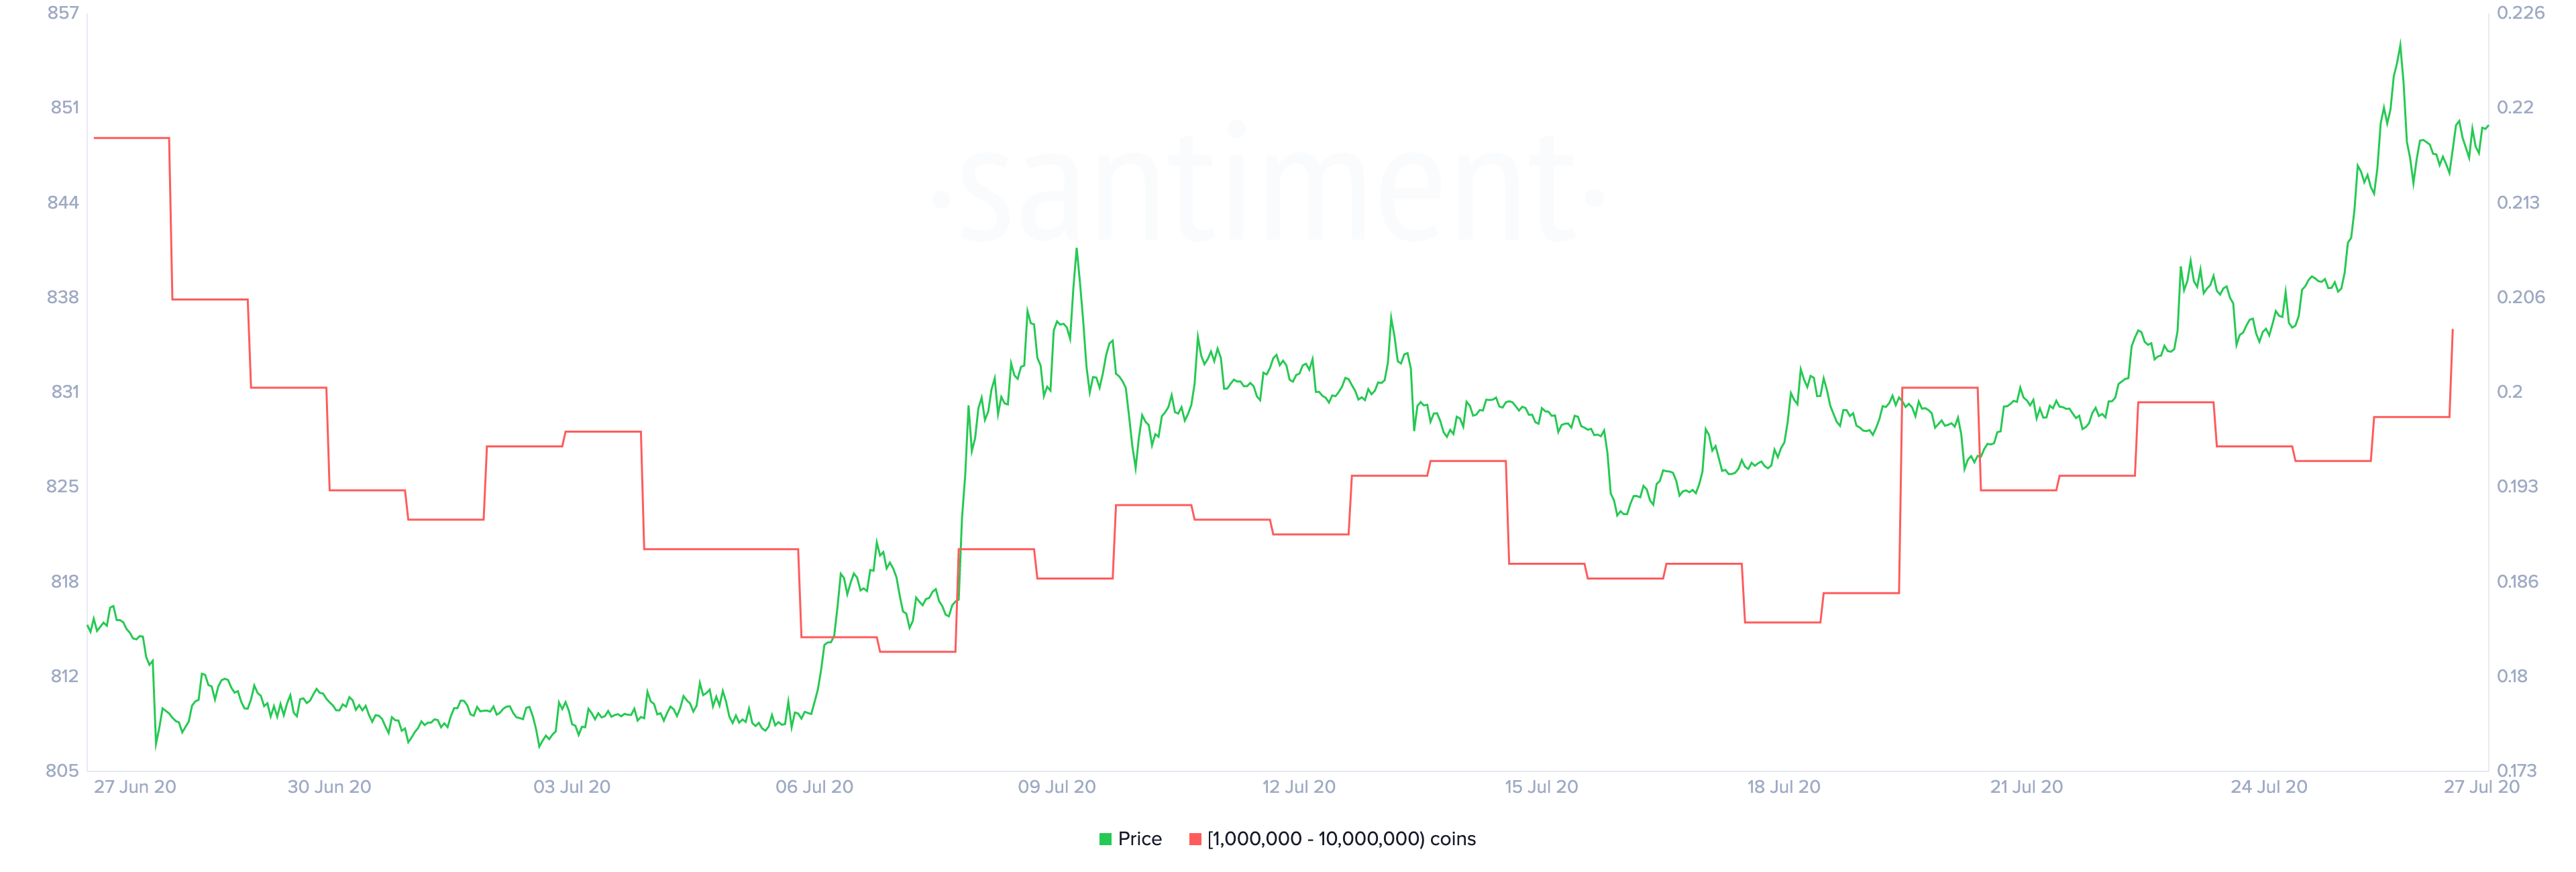
Large investors seem to be aware of such a probability since they have increased in numbers ever since XRP broke above its 200-day moving average.
Santiment’s holder distribution chart reveals that in the past three days, roughly nine new whales holding between 1 million and 10 million XRP have joined the network.
The spike in the number of large investors may seem insignificant at first glance. Still, when considering that they hold between $220,000 and $2.2 million worth of XRP, respectively, the sudden surge can translate into millions of dollars.
It is worth mentioning that the TD setup recently presented a sell signal on XRP’s 1-day chart. However, the increase in large investors behind this altcoin could invalidate the bearish formation.
Under such circumstances, the international settlements token must turn the 50% Fibonacci retracement into support to aim for $0.26 or higher. Failing to do so would likely trigger a correction back to the 200-day moving average.
The Crypto Market Moves Forward
All eyes are on Bitcoin, Ethereum, and XRP.
As these top tokens began to break out, some of the lower-cap altcoins started to decline. This market behavior suggests that money is flowing out of the so-called “shitcoins” and into the top-ranked cryptos.
As a result, investors appear to be growing overwhelmingly bullish on what the future holds for these cryptocurrencies. The Crypto Fear and Greed Index is currently sensing “greed” in the market, which isn’t necessarily a good sign from a contrarian point of view. This state of optimism may be significant enough to help validate the different sell signals presented by the TD sequential indicator.
Whether bullish or bearish, it is crucial to implement a robust risk management strategy now more than ever. As the market appears to be on the cusp of its next bullish cycle, having cash ready to deploy is a must.