
Bitcoin, Ethereum, and XRP Indicators Show Bullish Breakout Might Be a False Alarm
Bitcoin, Ethereum, and XRP appear to have reached an exhaustion point after the recent price action. Still, different metrics suggest that the uptrend would likely resume very soon.
The latest pump throughout the crypto market has left market participants clutching for answers. To better determine whether Bitcoin, Ethereum, and XRP are truly breaking out, we take a look at the most significant support and resistance levels for each crypto.
Bitcoin Aims for New Yearly Highs
Keep in mind, Bitcoin broke out of a clear bullish pennant on Jul. 21.
The distance between the highest point of this continuation pattern project an upward target of 15.7%. Thus, a further spike in the buying pressure behind the flagship cryptocurrency may see it rise to $10,700.
As Bitcoin aims for new yearly highs, data from IntoTheBlock reveals that the recent downward pressure is directly related to the massive supply barrier that lies ahead of it.
Based on the “In/Out of the Money Around Price” model, approximately 1.4 million addresses had previously purchased nearly 1 million BTC between $9,540 and $9,810.
Holders within this price range appear to be trying to break even in their long positions, providing a certain level of resistance to Bitcoin’s uptrend. Once the pioneer cryptocurrency can break through this hurdle, the IOMAP cohorts show that there isn’t any other barrier that will prevent it from reaching the target presented by the bullish pennant.
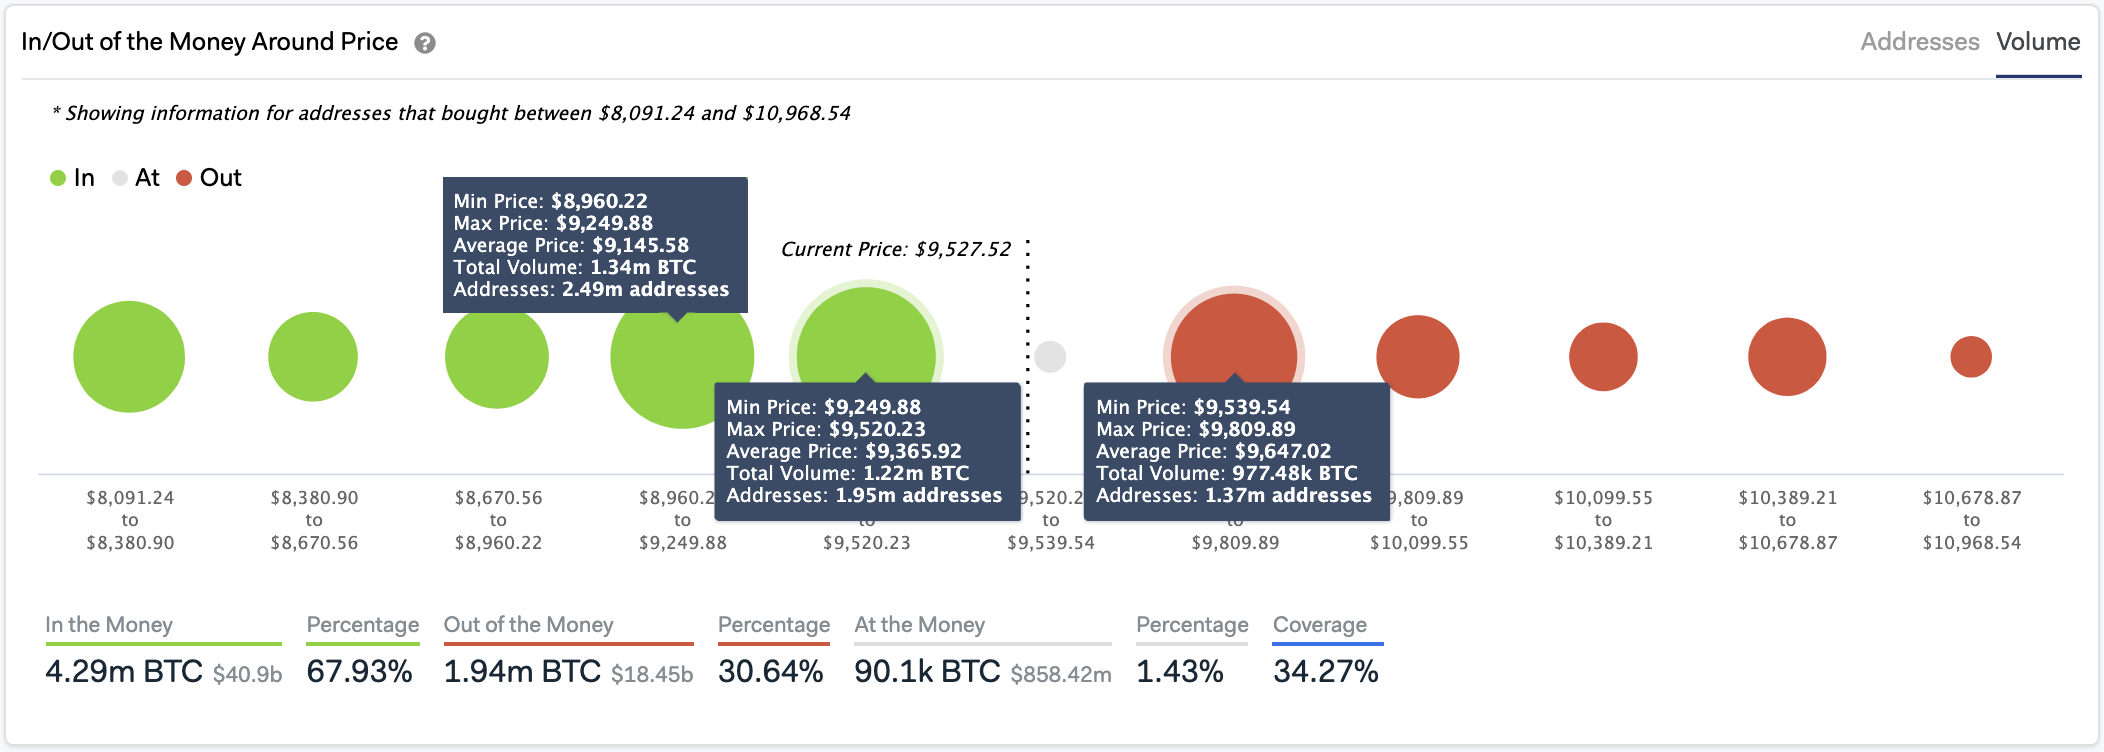
On the flip side, this on-chain metric indicates that roughly 4.5 million addresses bought more than 2.5 million BTC between $8,960 and $9,520. Such a significant area of interest would likely have the ability to hold in the event of a correction.
Ethereum Hits Five-Month High
The smart contracts giant shot up nearly 19% in the past four days slicing through the $250 resistance level for the first time since March.
While many expected a retest of mid-February’s high of $287, Ethereum fell short by roughly $6. Still, investors took advantage of the bullish price action to realize profits.
The considerable increase in sell orders at the $280 peak pushed Ether down by 4.4%. Regardless, the Fibonacci retracement indicator suggests that as long as Ethereum continues trading above $259, the uptrend will likely continue.
A similar outlook is presented by IntoTheBlock’s “In/Out of the Money Around Price” model.
This fundamental gauge reveals that there isn’t any considerable supply barrier ahead of Ether that will prevent it from surging towards $300 or higher.
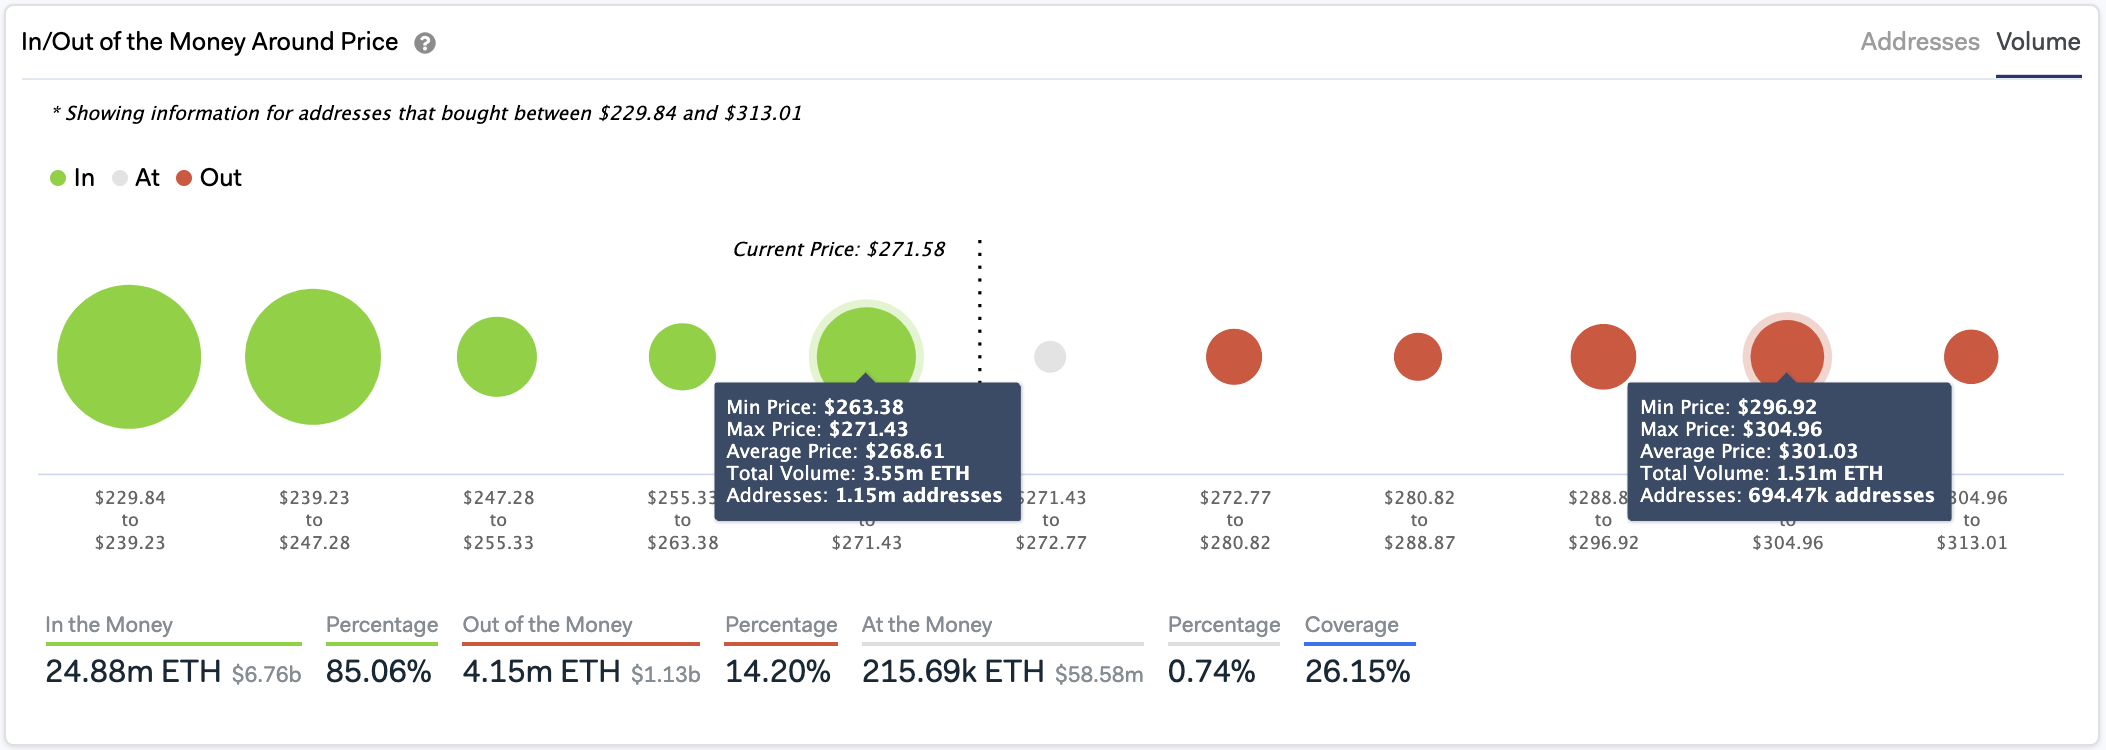
Meanwhile, several support walls that sit underneath this altcoin might absorb any downward pressure.
The first one sits between $263 and $271, where 1.15 million addresses bought 3.55 million ETH. The second and most significant hurdle lies between $230 and $247. Here, the IOMAP cohorts reveal that 4.6 million addresses hold more than 18 million ETH.
Investors who entered the market when Ethereum was trading around $240 will try to remain profitable in the event of a downswing. They may even buy more ETH and allow prices to rebound to higher highs.
XRP Trades Between 2 Key Barriers
While Bitcoin and Ethereum are breaking out, XRP faces stiff resistance.
The 200-day moving average continues to hold. Consequently, impeding the cross-border remittances token from achieving its upside potential.
Due to the strength of this hurdle, only a daily candlestick close above it can serve as confirmation that this cryptocurrency is poised for higher highs. If this were to happen, XRP might be able to surge to the next resistance levels that sit at $0.23 and $0.26.
In the meantime, investors should watch out for the 50-day moving average since it serves as a support wall for XRP. Moving past this area will invalidate the bullish outlook.
It could even result in a price drop towards the next level of support around $0.17.
Bitcoin Leads the Crypto Market Forward
Global economies continue to suffer the impact of the ongoing pandemic. As a result, most central banks have opted to continue dolling out stimulus packages and printing money.
The idea is to continue asset purchasing programs “in the amounts needed to support smooth market functioning,” as the Federal Reserve affirmed in late March.
Although quantitative easing has served as a cushion for other financial crises in the past, cryptocurrencies now provide investors a novel opportunity to hedge against risk. The rise of this new asset class has been so significant that the U.S. Office of the Comptroller of the Currency (OCC) recently allowed banks to serve as crypto custodians.
While many remain skeptical, mainstream adoption of cryptocurrencies is happening now.
For this reason, investors must pay close attention to the support and resistance levels previously mentioned because the crypto market sits on the cusp of a new bullish cycle.