
Stellar Lumen Price Analysis XLM / USD: Not So Lumenous
Lumens are not looking Stellar
- Stellar Lumen has a bearish short-term trading bias, with the cryptocurrency tumbling below key technical support
- The four-hour time frame shows that sellers are attempting to invalidate a bullish inverted head and shoulders pattern
- The daily time frame shows that a large head and shoulders pattern could be forming
Stellar Lumen / USD Short-term price analysis
Stellar Lumen has a bearish short-term outlook, with the cryptocurrency testing back towards trading levels not seen since early March 2019.
The four-hour time frame is showing that XLM / USD sellers are attempting to invalidate a large inverted head and shoulders pattern, following a heavy technical rejection from neckline resistance.
Technical indicators are bearish on the four-hour time frame and still show significant scope to move lower.
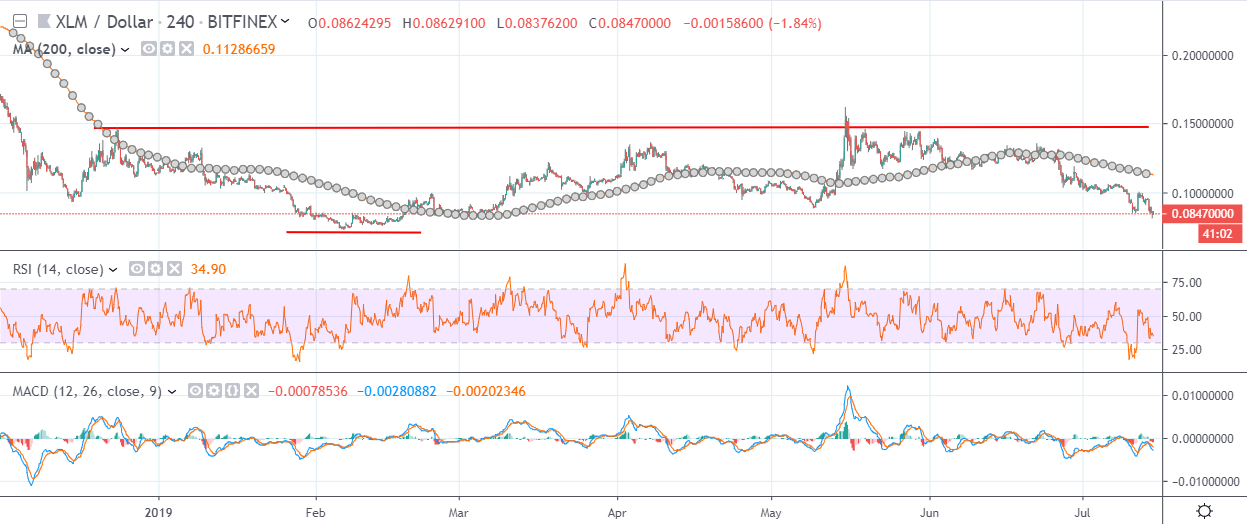
Pattern Watch
Traders should note that the invalidation of the inverted head and shoulders pattern will be considered heavily bearish for the XLM / USD pair.
Relative Strength Index
The RSI indicator is bearish on the four-hour time frame and still shows scope for significant downside.
MACD Indicator
The MACD indicator is bearish on the four-hour time frame and is currently generating a strong sell signal.
Stellar Lumen / USD Medium-term price analysis
Stellar Lumen has a bearish medium-time outlook, with the XLM / USD pair now trading well below its trend defining 200-day moving average.
The daily time frame shows that a bearish head and shoulders pattern could start to form if sellers force price toward the XLM / USD pair’s all-time trading low.
Technical indicators on the daily time frame have turned bearish and still show scope for further downside.
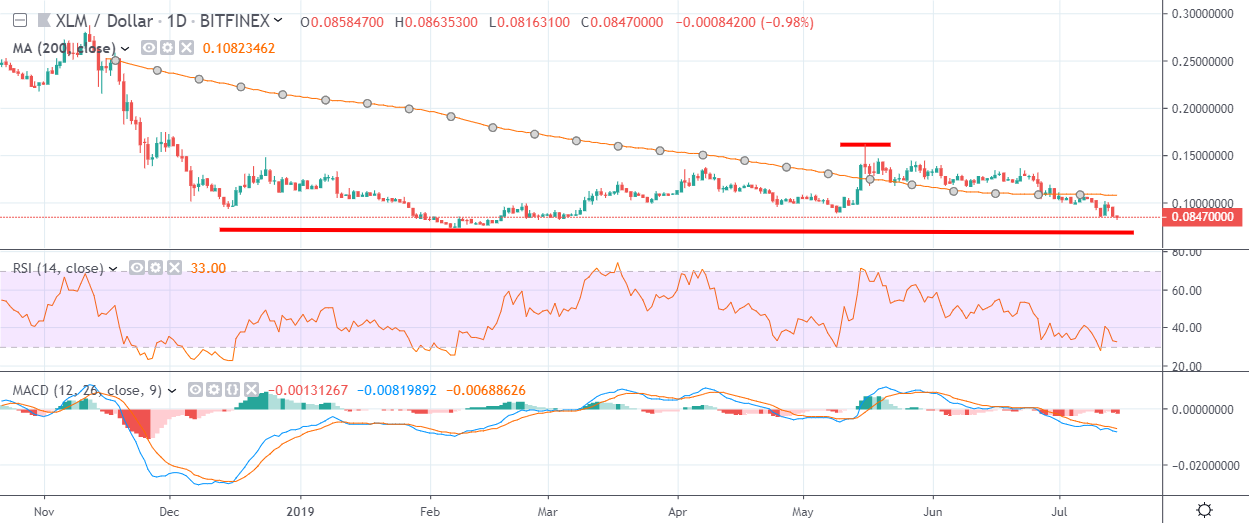
Pattern Watch
Traders should note that a technical meltdown could occur if the XLM / USD pair slips below its all-time trading low.
Relative Strength Index
The RSI indicator is bearish on the daily time frame and is now approaching oversold territory.
MACD Indicator
The MACD indicator is bearish on the daily time frame and is currently issuing a sell signal.
Conclusion
Stellar Lumen has now started to move aggressively lower, as the cryptocurrency continues to weaken below its 200-day moving average.
Intense focus with now be placed on the possible invalidation of the inverted head and shoulders pattern and the possible creation of a much larger bearish pattern.
Check out our coin guide for XLM.
Our analyst team also covered Stellar, offering a deep look into the project.