
XRP Price Analysis: Ripple-Promoted Token Makes U-Turn
XRP currently lacks any bullish potential.
- The Ripple-promoted token has reversed sharply lower after rallying to a fresh 2019 trading high
- The four-hour time frame shows that a potential bearish head and shoulders pattern could be forming
- The daily time frame highlights the absence of any new bullish patterns
XRP / USD Short-term price analysis
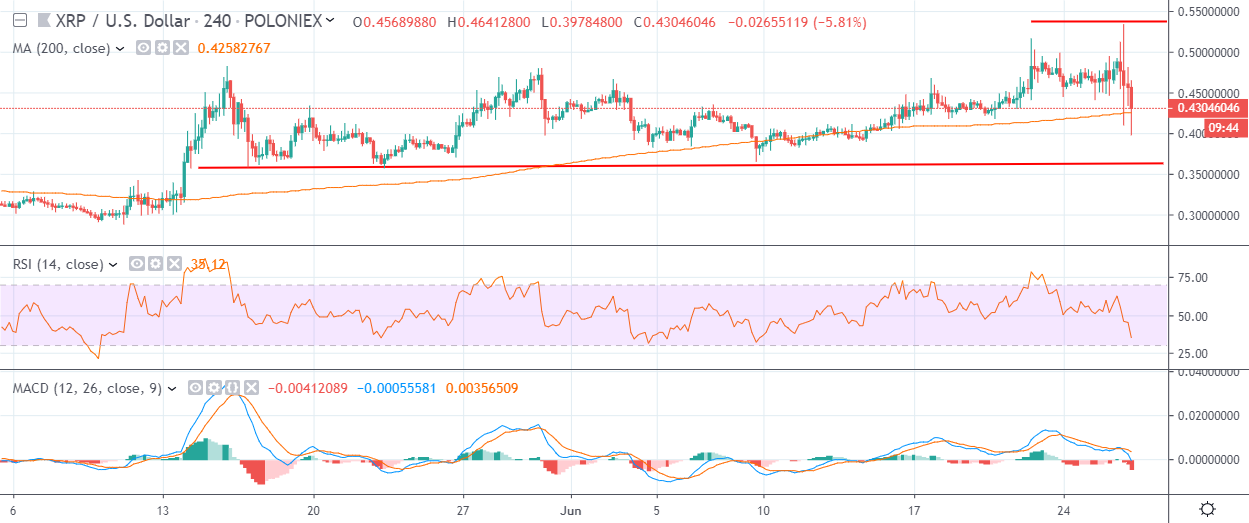
XRP has a neutral short-term trading outlook, with the XRP / USD pair testing back towards its 200-period moving average on the four-hour time frame.
The four-hour time frame is showing that the XRP / USD pair has reversed sharply lower, after briefly spiking above the 0.5000 level. A potential bearish head and shoulders pattern is starting to emerge on the mentioned time frame.
Technical indicators across the four-hour time frame are bearish and continue to generate sell signals.
Pattern Watch
Traders should closely monitor the $0.3650 level, as it forms the neckline of the bearish head and shoulders pattern.
Relative Strength Index
The RSI indicator has turned bearish on the four-hour time frame and continues to issue a sell signal.
MACD Indicator
The MACD indicator is bearish on the four-hour time frame, with both MACD signal line and histogram issuing sell signals.
XRP / USD Medium-term price analysis
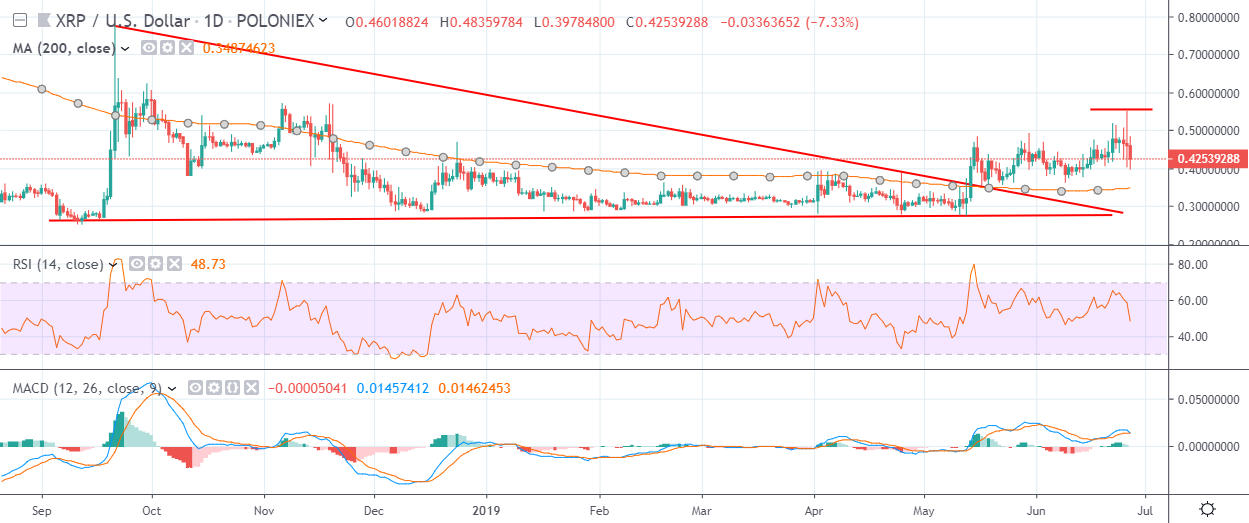
XRP has a bullish medium-term trading outlook, with the XRP / USD pair still holding above its breakout point on the daily time frame.
The daily time frame is showing that a large bearish reversal candle has formed, with the XRP / USD pair relinquishing a large portion of its hard-earned gains.
Indicators on the daily time frame are turning lower and are attempting to turn bearish.
Pattern Watch
Traders should note that upcoming critical technical support on the daily time frame remains at the $0.3650 and $0.3000 levels.
Relative Strength Index
The Relative Strength indicator on the daily time frame is also starting to turn bearish.
MACD Indicator
The MACD indicator on the daily time frame is attempting to turn bearish as medium-term selling pressure builds.
Conclusion
XRP is coming under increasing downside pressure across both time frames, after swiftly reversing from its current 2019 trading high.
With the absence of any new bullish patterns and technical indicators pointing lower, an upcoming test major support appears the most likely scenario.
Find out more about Ripple and XRP in our coin guide.
A deeper look into the merits of the project can be found in our DARE.