Skip to content
Advertisement
Nvidia posts $96.2B quarterly revenue as Jensen Huang prepares to talk strategy on Mad Money

Nvidia posts $96.2B quarterly revenue as Jensen Huang prepares to talk strategy on Mad Money

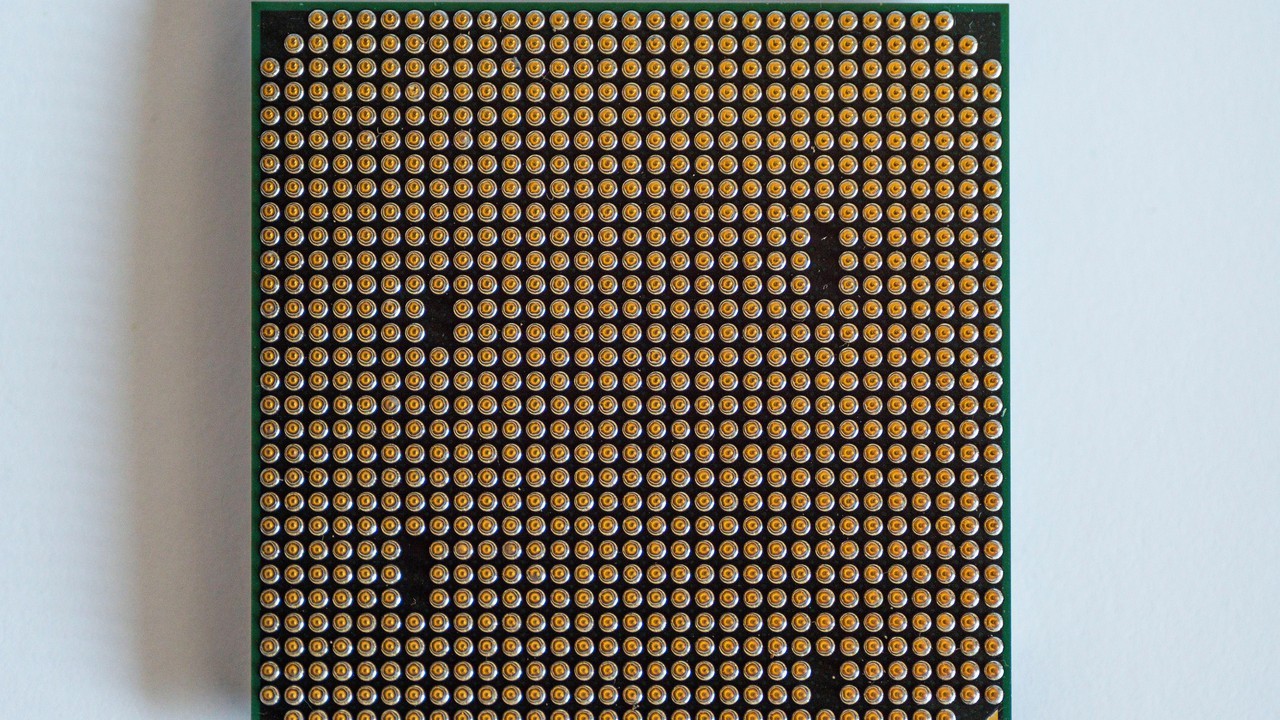
Photo: SHOX ART / Pexels

The chipmaker's fiscal Q2 results crushed estimates on the back of relentless AI data-center demand, and now the CEO heads to primetime TV to explain what comes next

Nvidia just turned in a quarter that makes most Fortune 500 companies’ annual revenue look like a rounding error. The chipmaker reported fiscal Q2 2027 revenue of $96.22 billion, a 106% increase year-over-year, and CEO Jensen Huang is scheduled to appear on CNBC’s “Mad Money” at 6 p.m. ET to break down what it all means.

The number beat Wall Street’s consensus estimate of roughly $92.2 billion by a comfortable margin.

The numbers behind the blowout

Nvidia’s data-center segment generated $89 billion in revenue during the quarter. That’s a 117% jump compared to the same period last year, and it accounts for the vast majority of the company’s total sales.

Advertisement

Adjusted earnings per share came in at $2.22, topping the consensus forecast of $2.10. GAAP gross margin held at 75%.

Quarter-over-quarter growth clocked in at 18%.

Nvidia also declared a quarterly dividend of $0.25 per share, payable on October 1, 2026.

Guidance that keeps the momentum going

Nvidia expects Q3 fiscal 2027 revenue of approximately $108 billion, plus or minus 2%.

Gross margin guidance for the next quarter is 74%, give or take 50 basis points.

One notable detail buried in the outlook: Nvidia’s Q3 guidance includes zero revenue from data-center compute operations in China. US export restrictions have effectively walled off that demand, and Nvidia is apparently no longer banking on it at all.

What Huang is likely to discuss

Huang has framed this moment as a turning point for artificial intelligence, describing the AI infrastructure buildout as operating “at full steam.” His “Mad Money” appearance with Jim Cramer will likely expand on that theme.
NVIDIA Corporation and its peers

Company PriceMarket capP/E (trailing)Forward P/EAnnual revenue (USD)Annual revenue growthAnnual net income (USD)Operating margin
NVIDIA Corporation NVDA · Price dated Oct 29, 2026 · tokenized NVDAx $214$5.1T27.0Unavailable$215.9BFY ended 2026-01-25 · 10-K+65.5%FY ended 2026-01-25 vs 2025-01-26 · 10-K120,067,000,000FY ended 2026-01-25, attributable to the company · 10-K60.4%FY ended 2026-01-25
Broadcom Inc. AVGO · Price dated Oct 29, 2026 · tokenized AVGOx $345$1.6T44.0Unavailable$63.9BFY ended 2025-11-02 · 10-K+23.9%FY ended 2025-11-02 vs 2024-11-03 · 10-K23,126,000,000FY ended 2025-11-02, consolidated · 10-K39.9%FY ended 2025-11-02
Micron Technology Inc. MU · Price dated Oct 29, 2026 · tokenized MUx $934$1.1T12.6Unavailable$133.2BFY ended 2026-09-03 · 10-K+256.3%FY ended 2026-09-03 vs 2025-08-28 · 10-K84,969,000,000FY ended 2026-09-03, attributable to the company · 10-K74.6%FY ended 2026-09-03
Advanced Micro Devices Inc. AMD · Price dated Oct 29, 2026 · tokenized AMDx $566$924.7B145.2Unavailable$34.6BFY ended 2025-12-27 · 10-K+34.3%FY ended 2025-12-27 vs 2024-12-28 · 10-K4,335,000,000FY ended 2025-12-27, attributable to the company · 10-K10.7%FY ended 2025-12-27

Missing figures stay unavailable. Forward P/E requires a dated source. Annual revenue, revenue growth, net income and margin come from each company's own 10-K, in US dollars, and each row shows that fiscal year. Revenue growth compares the fiscal year with the prior year stated in the same 10-K. Net income is the full year amount attributable to the company, or available to common stockholders where the filing states only that, or consolidated net income. Each row names its basis. Trailing P/E reads "Not meaningful" when the dated trailing diluted EPS is a loss or zero. An operating margin appears only when the filing states both the operating income and the revenue for the same year.

Sources: SEC filings, Gloria daily closes and CoinGecko. Oldest record refresh: Oct 30, 2026, 9:56 AM EDT. Refresh is not a price or filing date. Each row shows its price date and its annual fiscal period. Peers use industry code and company size, or editorial selection. Market cap multiplies that row price by the company share total the latest SEC filing states for every share class together. Trailing P/E divides it by trailing diluted earnings from SEC filings. Rolled earnings per share are approximate because share counts can change between periods. Both appear only when the SEC data carries its date, so they are estimates at one price date, not synchronized filing valuations. Not investment advice.

Disclosure: This article was edited by Editorial Team. For more information on how we create and review content, see our Editorial Policy.

More in Technology

See all
Previous storyMeta demands TikTok and YouTube adopt same safety changes before paying full $18B settlement