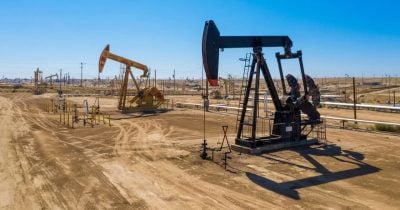
Trump says oil companies including Exxon and Chevron are making too much money based on the shortage, reiterating that oil firms had better cut the retail price
Unavailable: no trailing SEC earnings: no complete trailing window in the SEC EPS data
Annual revenue
Unavailable: no annual filing figure
Annual revenue growth
Unavailable: no annual filing figure
Annual net income
Unavailable: no annual filing figure
Annual operating margin
Unavailable
Forward P/E
Unavailable: no dated forecast source
Gloria daily close for session Oct 28, 2026. Market cap and trailing P/E use this close with the SEC share total and trailing diluted earnings, each dated next to its figure. Annual revenue, revenue growth, net income and margin show their own fiscal period and link the 10-K. Current context may postdate this article.
7,988,000,000FY ended 2025-12-31, attributable to the company · 10-K
Unavailable
Missing figures stay unavailable. Forward P/E requires a dated source. Annual revenue, revenue growth, net income and margin come from each company's own 10-K, in US dollars, and each row shows that fiscal year. Revenue growth compares the fiscal year with the prior year stated in the same 10-K. Net income is the full year amount attributable to the company, or available to common stockholders where the filing states only that, or consolidated net income. Each row names its basis. Trailing P/E reads "Not meaningful" when the dated trailing diluted EPS is a loss or zero. An operating margin appears only when the filing states both the operating income and the revenue for the same year.
Sources: SEC filings, Gloria daily closes and CoinGecko. Oldest record refresh: Oct 28, 2026, 4:26 PM EDT. Refresh is not a price or filing date. Each row shows its price date and its annual fiscal period. Peers use industry code and company size, or editorial selection. Market cap multiplies that row price by the company share total the latest SEC filing states for every share class together. Trailing P/E divides it by trailing diluted earnings from SEC filings. Rolled earnings per share are approximate because share counts can change between periods. Both appear only when the SEC data carries its date, so they are estimates at one price date, not synchronized filing valuations. Not investment advice.
Former U.S. President Donald Trump has criticized major oil companies, including Exxon and Chevron, for making excessive profits amid global oil shortages and has called for reductions in retail gasoline prices. His comments come as the oil market faces tight conditions, with supply expected to fall below demand due to geopolitical tensions in the Middle East. The remarks add to existing political pressure for fuel retailers to lower prices, aligning with Trump’s previous demands in late June for immediate price reductions. Both Exxon and Chevron have recently reported record profits, amplifying the scrutiny on their pricing strategies.
Trump’s statements could influence the prediction markets relating to crude oil prices. Current pricing suggests that markets view a decrease in the likelihood of crude oil reaching a new all-time high by the end of September. The “Will Crude Oil reach a new all-time high by September 30?” market shows a slight decrease in YES pricing to 4.7%, down from 5% a week ago. The December 31 market remains at 11.5% YES, suggesting that participants see limited catalysts for a significant price increase in the near term.
Key Takeaways
Trump’s comments appear to suggest that oil companies face increased political pressure to reduce retail prices, consistent with a decrease in crude oil price expectations.
The September 30 market reflects a slight decrease in the expectation of crude oil reaching a new all-time high, with YES pricing at 4.7%.
Current market dynamics indicate that participants may anticipate stable or decreasing oil prices through the end of the year.
What to Watch
Watch for any policy moves or statements from key political figures, including Trump, that could influence oil pricing. The ongoing geopolitical situation in the Middle East and any developments in U.S. energy policy will be crucial in shaping market expectations. Observers should also pay attention to quarterly earnings reports from major oil companies, as significant profit announcements may further impact pricing dynamics.
Disclosure: This article was edited by Estefano Gomez. For more information on how we create and review content, see our Editorial Policy.