Bitcoin, Ethereum Poised for Volatility
Bitcoin and Ethereum could be on the brink of a significant price movement.

Key Takeaways
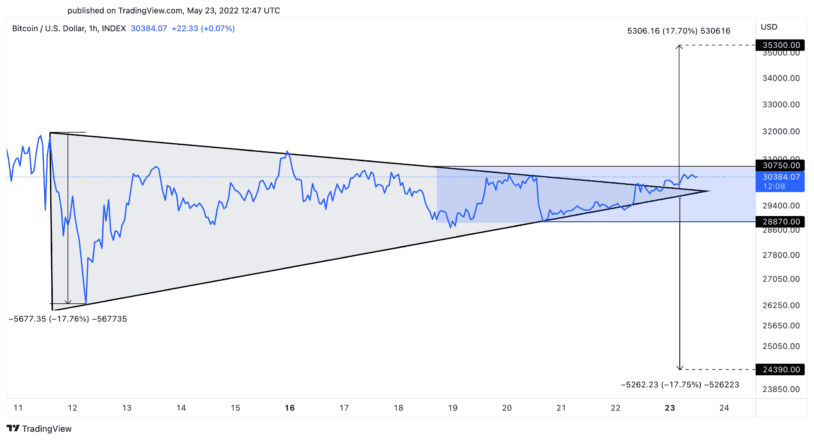
- Bitcoin is in a no-trade zone between $28,870 and $30,750.
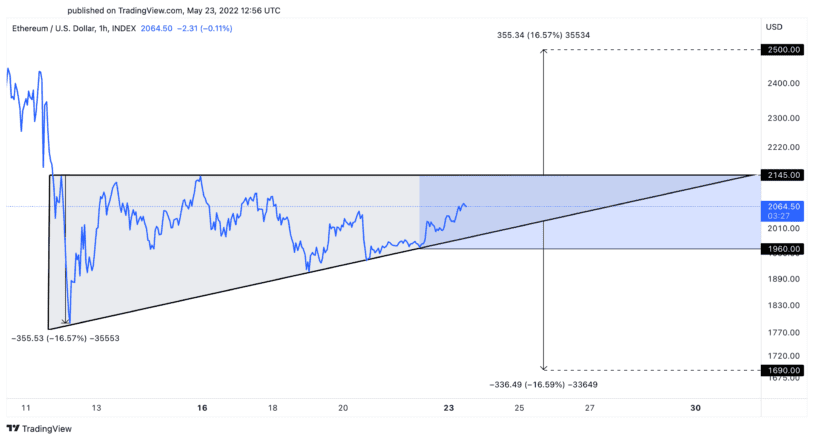
- Likewise, Ethereum is stuck between $1,960 and $2,145.
- Only a break above support or below resistance can resolve the ambiguity.
Share this article
Bitcoin and Ethereum continue to consolidate while searching for new catalysts that will help them gain the momentum needed to break out.
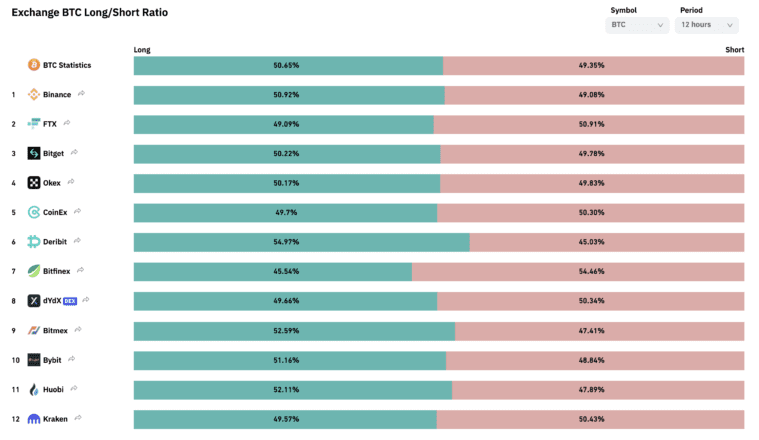
Crypto Traders Are 50/50
Bitcoin and Ethereum remain stagnant, trading within a tight price range, as traders cannot decide on whether prices will go up or down.
Data from Coinglass shows that market participants are divided on what the future holds for Bitcoin and Ethereum. Roughly 50% of all accounts with open BTC positions across all major crypto derivatives exchanges are net-long, while the other 50% are net-short. Similar trading history can be seen around ETH.
The lack of certainty among market participants about the future price action is wearing down Bitcoin and Ethereum.
The top two cryptocurrencies by market cap continue to consolidate within no-trade zones, waiting for a spike in volatility. The longer BTC and ETH get squeezed, however, the more prominent the price movement that should follow. But the problem is determining the direction in which the trend will resolve.
Bitcoin, Ethereum Await Catalysts
For instance, Bitcoin has defined a clear support floor at $28,870 and a stiff resistance barrier at $30,750. A decisive four-hour candlestick close outside of this range will determine where BTC will go next. The formation of a symmetrical triangle suggests that upon the break of the stagnation period, prices will move by 17.70%.
Under such circumstances, a breach of the $30,750 resistance level might result in an upswing to $35,300, while dipping below the $28,870 could see Bitcoin take a nosedive to $24,400.
Ethereum is also showing ambiguity as long as it continues to trade between $1,960 and $2,145. Only a sustained four-hour close below support or above resistance can help determine where ETH will go next. It is reasonable to remain on the sidelines waiting for the trend to resolve until that happens.
The reason to remain patient with Ethereum is that it appears to be forming an ascending triangle on the four-hour chart. The height pattern’s y-axis suggests that a break of the hypotenuse at $1,960 or the x-axis at $2,145 could result in a 16.57% price movement.
Bitcoin and Ethereum have yet to find new catalysts to help them gain the trading volume needed to break out. Meanwhile, other coins like Fantom have managed to post significant gains after finding the “it” factor needed in form of a new proposal from Andre Cronje.
Disclosure: At the time of writing, the author of this piece owned BTC and ETH.
Share this article
