Aave Looks Poised to Rebound
AAVE has plummeted against the U.S. dollar and ETH over the past week, but it may have found a stable support level.

Key Takeaways
- Several mid-cap tokens are outperforming the two leading cryptocurrencies.
- However, AAVE has incurred significant losses after struggling to gain momentum throughout the year.
- Technical patterns now show that AAVE is primed for a bullish impulse.
Share this article
AAVE has not experienced the same bullish price action that many other assets have seen throughout this year. Nonetheless, the DeFi token appears to have reached a demand barrier that could lead to a rebound.
DeFi Tokens Gains Traction
Aave could be preparing to follow the bullish momentum of other assets in the market.
Several mid-cap tokens including Avalanche’s AVAX, Loopring’s LRC, and Curve’s CRV have risen by more than 20% over the past week despite the two leading cryptocurrencies, Bitcoin and Ethereum, posting a decline against the U.S. dollar. Avalanche recorded a new all-time high of $144.96 Sunday.
Data from DeFi Pulse shows that over $7 billion has been added to the total value locked in DeFi protocols over the past week, even as the total cryptocurrency market capitalization has dropped by nearly 8%. The sudden spike shows the growing interest in the nascent sector of the market.
Interestingly, some DeFi projects such as Aave are yet to enjoy the same upward price action. The DeFi blue chip’s AAVE token is down by roughly 10% against the U.S. dollar over the past week, and the losses are even more significant for the AAVE/ETH trading pair. Ethereum has outperformed DeFi tokens like AAVE throughout the year.
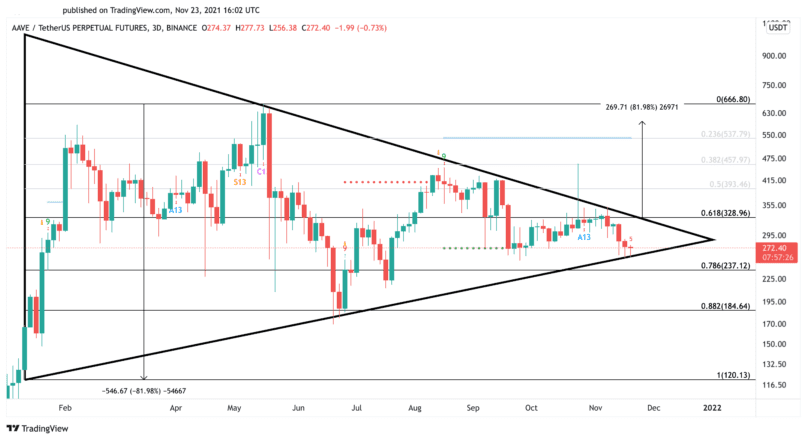
AAVE has endured an eleven-month-long consolidation period. It’s recorded a series of lower highs and higher lows since the beginning of the year, without providing a clear outlook of where it is heading next. The market behavior appears to have developed a symmetrical triangle on its three-day chart.
AAVE’s move toward the pattern’s apex signals that a spike in volatility is underway. The distance between the triangle’s highest points suggests that the ongoing stagnation period could culminate in a price movement of up to 82%. Still, AAVE must first print a daily candlestick close above the $330 resistance level to advance toward its previous all-time high at nearly $667.
However, any signs of weakness around the $237 support level could invalidate the bullish outlook and result in a 22% correction.
The AAVE/ETH trading pair also looks ready to rebound after plummeting by more than 80% since early February.
The Tom DeMark (TD) Sequential indicator has presented a buy signal on the three-day chart. The bullish formation developed as a red nine candlestick, indicative of a one to four three-day candlesticks upswing or the beginning of a new uptrend.
Rising buying pressure around the current price levels could push AAVE to 0.075 ETH. The DeFi token could break this resistance level and surge toward 0.12 ETH if the uptrend is strong enough.
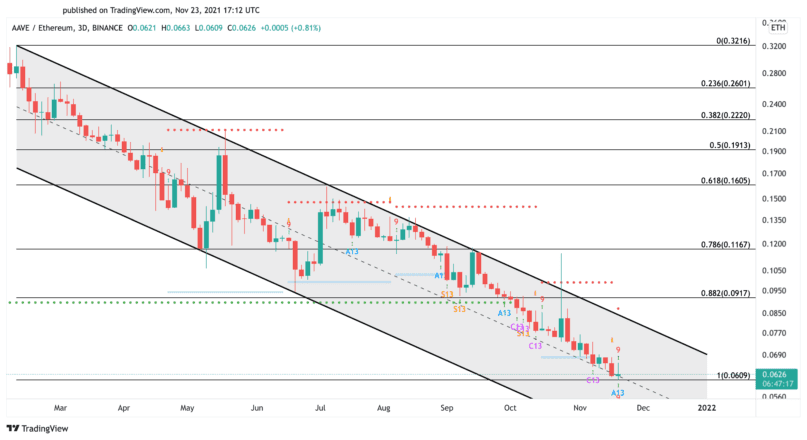
It is worth noting that all the buy signals the TD setup has presented since February have led to a quick upward price action succeeded by further lower lows. The 0.061 ETH support level is notable, as breaching this price point could lead to a 26% retracement to 0.045 ETH.
Disclosure: At the time of writing, the author of this feature owned BTC and ETH.
Share this article
