Ark Price Analysis ARK / USD: Not Enough Juice
The inability to move above its former high is weighing on the ARK/ USD pair.

Share this article
- Ark has a bullish short-term bias, with the ARK / USD pair continuing to trade above its key 200-period moving average on the four-hour time frame
- The four-hour time frame is showing that a large head and shoulders pattern has formed
- The daily time frame is showing a much larger bearish pattern has formed
Ark / USD Short-term price analysis
Ark has a bullish short-term trading outlook, with the cryptocurrency continuing to trade above its 200-period moving average on the four-hour time frame.
The four-hour time frame shows that a complex head and shoulders pattern has now formed, following recent failed attempts to breach the ARK / USD pair’s former monthly trading high.
Technical indicators on the four-hour are mixed and still failing to generate a clear trading signal.
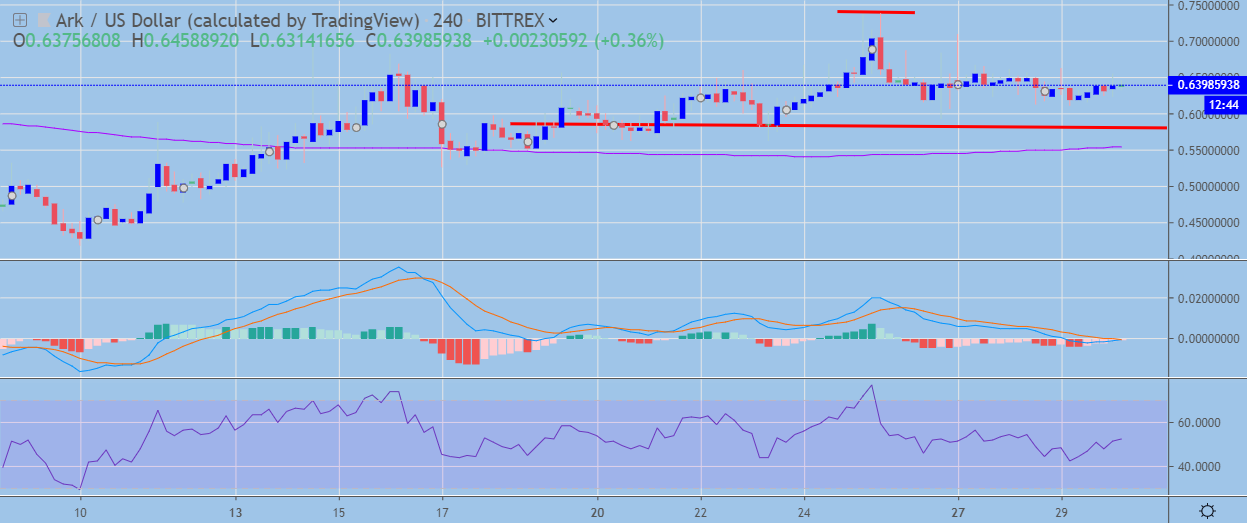 ARK / USD H4 Chart by TradingView
Pattern Watch
Traders should note that the May 10th swing-low is the current bearish target of the head and shoulders pattern on the four-hour time frame.
Relative Strength Index
The RSI indicator is neutral on the four-hour time frame, although upside pressure is currently building.
MACD Indicator
The MACD indicator has turned bearish on the four-hour time frame and is currently generating a sell signal.
Ark / USD Medium-term price analysis
Ark has a bullish medium-term outlook, with the cryptocurrency still managing to hold above its key 200-day moving average.
The daily time frame is showing that a large head and shoulders pattern has formed, with the current 2019 trading low the overall downside target of the bearish pattern.
Technical indicators on the daily time frame are bullish, although they are starting to appear overstretched.
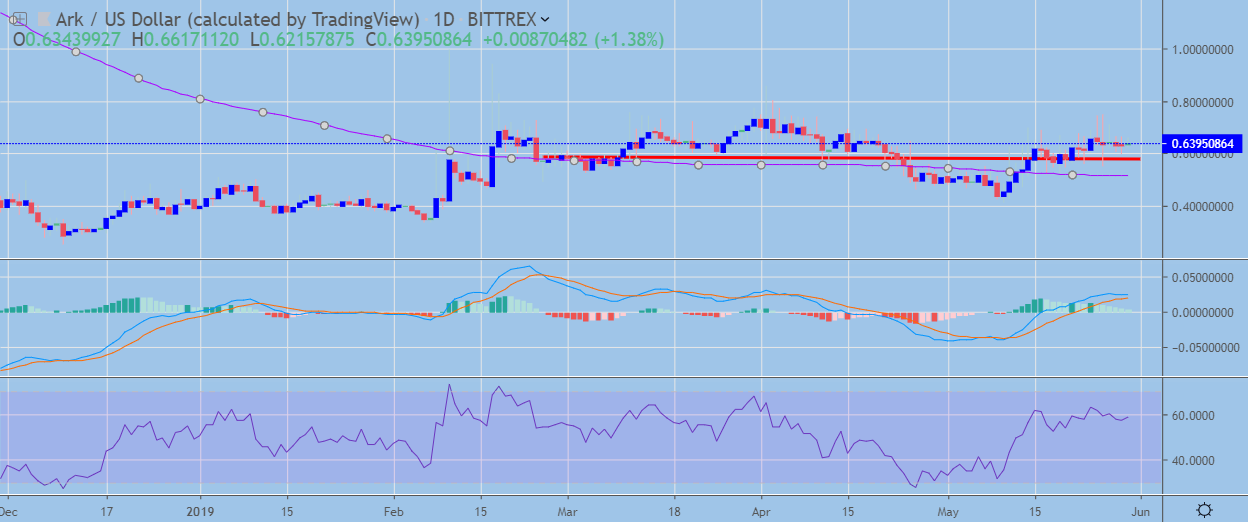 ARK / USD Daily Chart by TradingView
Pattern Watch
Traders should note that a bullish pattern could form on the daily time frame if ARK / USD buyers can rally the cryptocurrency above the April monthly trading high.
Relative Strength Index
The RSI indicator is also bullish on the daily time frame, although downside pressure is starting to build.
MACD Indicator
The MACD indicator is bullish on the daily time frame, although it is starting to appear overstretched.
Conclusion
Ark is coming under increasing downside pressure over both time frames, with the ARK / USD pair’s inability to rally above its former monthly trading high starting to weigh on the cryptocurrency.
Bearish patterns forming on the four-hour and daily time frame suggest a much deeper downward move could take place, with the May 10th trading low the first downside target.
Share this article
