Bitcoin Cash Price Analysis BCH / USD: Another $10 To Liftoff
Today's upswing brings lack of resistance into play.

Share this article
- Bitcoin Cash is currently bearish over both the short-term and the medium-term
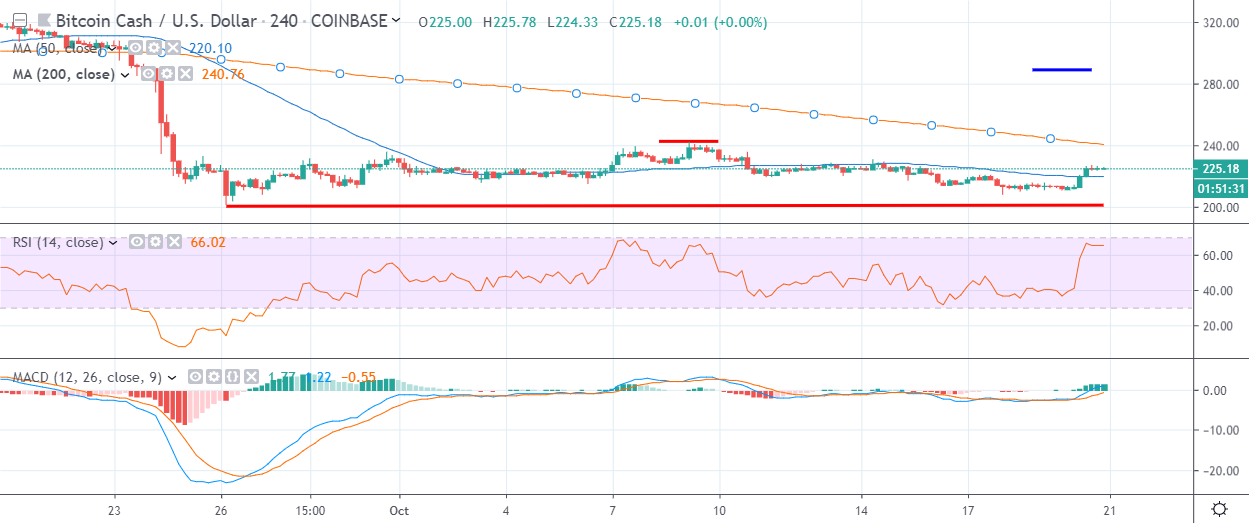
- The four-hour time is showing that a breakout above the $242.00 level could trigger a major up move
- A bearish head and shoulders pattern is still weighing on the BCH USD pair
Bitcoin Cash has moved away from the worst levels of the trading month, with the cryptocurrency now trapped in a period of sideways consolidation around its monthly opening price.
A run-up in price to $232.64 over the last few hours, however, has begun to indicate that a breakout could be imminent.
The BCH / USD pair is still technically bearish over both the short and medium-term, leaving the prospect of further downside ahead for the cryptocurrency. However, failure to maintain price below the $215.00 level also leaves the possibility of an upside rebound on the table.
A move above the $242.00 level would invalidate a bearish head and shoulders pattern on the lower time frames. The BCH / USD pair’s 200-period moving average on the four-hour time frame is also located at the $242.00 level.
If a bullish breakout does occur, the BCH / USD pair should rally toward the $290.00 level. A sustained break above the $325.00 level would confirm that the medium-term bear trend is likely over.
Looking at the downside, a break under the $215.00 would be negative for the BCH / USD pair this week. The $200.00 level is currently the neckline of the bearish head and shoulders pattern, and could trigger a substantial decline towards $160.00 level if broken.
Sentiment
According to the latest sentiment data from TheTIE.io, the short-term sentiment towards Bitcoin Cash is neutral, at 52.00 %, while the overall long-term sentiment towards the cryptocurrency is also neutral, at 49.00%.
Upside Potential
The four-hour time frame highlights that bulls need to move price above the $242.00 level to invalidate a bearish head and shoulders pattern. The BCH / USD pair has only limited technical resistance until the $290.00 level.
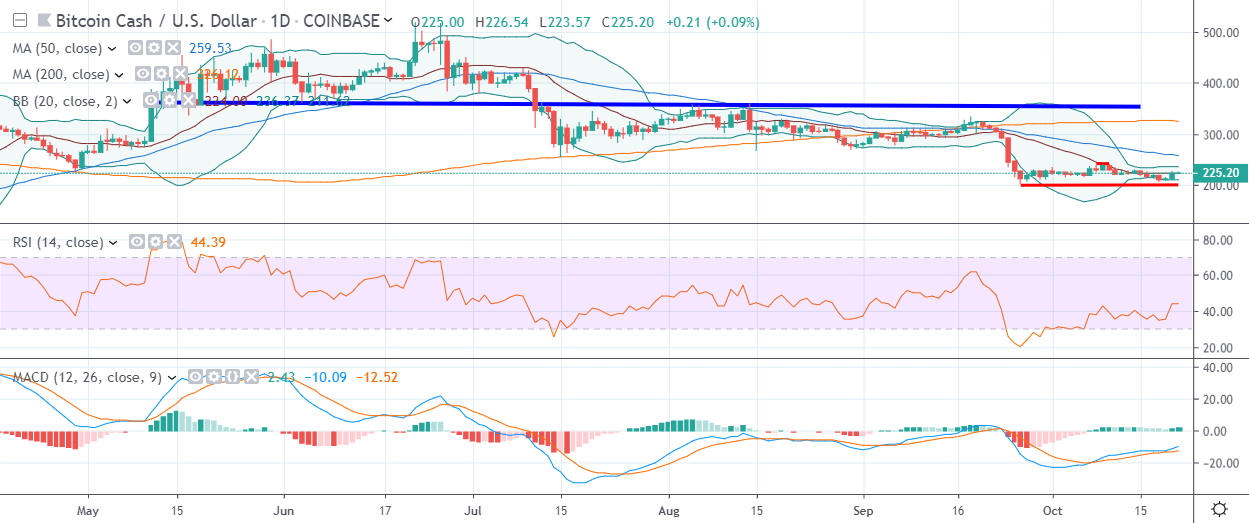
The daily time frame shows that a major technical breakout could occur if bulls rally price above the $325.00 level. It is worth noting that a rally of over forty percent would have to occur in order for this to happen.
Downside Potential
The four-hour time frame is currently showing that the short-term trend remains extremely bearish while price trades below the $215.00 level.
The daily time frame is showing that price could fall towards the $160.00 level if a breakout occurs below the current September trading low.
Summary
Bitcoin Cash faces a pivotal trading week ahead as price consolidates around its yearly opening price.
Technical analysis on the lower time frames highlights that a breakout from the $215.00 to $242.00 trading range will likely determine the next directional large move.
Check out our coin guide for Bitcoin Cash.
Share this article
