
Bitcoin Cash Price Analysis BCH/USD: Critical Juncture
BCH / USD Price Analysis - Bitcoin Cash is about to reverse its previously solid technicals as the market took it down.
- Bitcoin Cash has a bearish short-term and medium-term trading bias
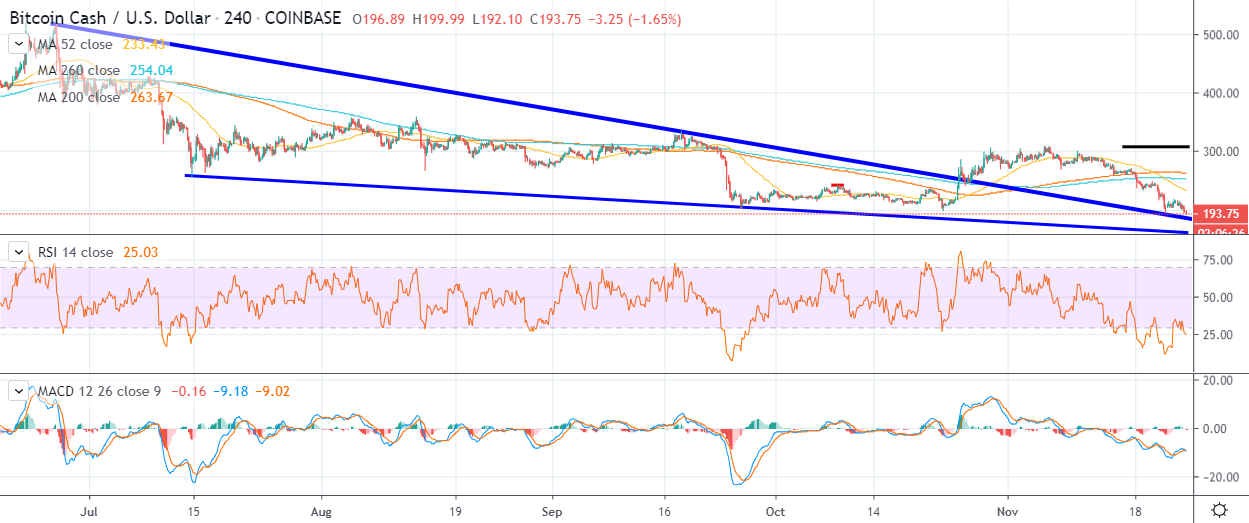
- The four-hour time frame shows that the BCH/USD pair is testing a large falling wedge pattern channel
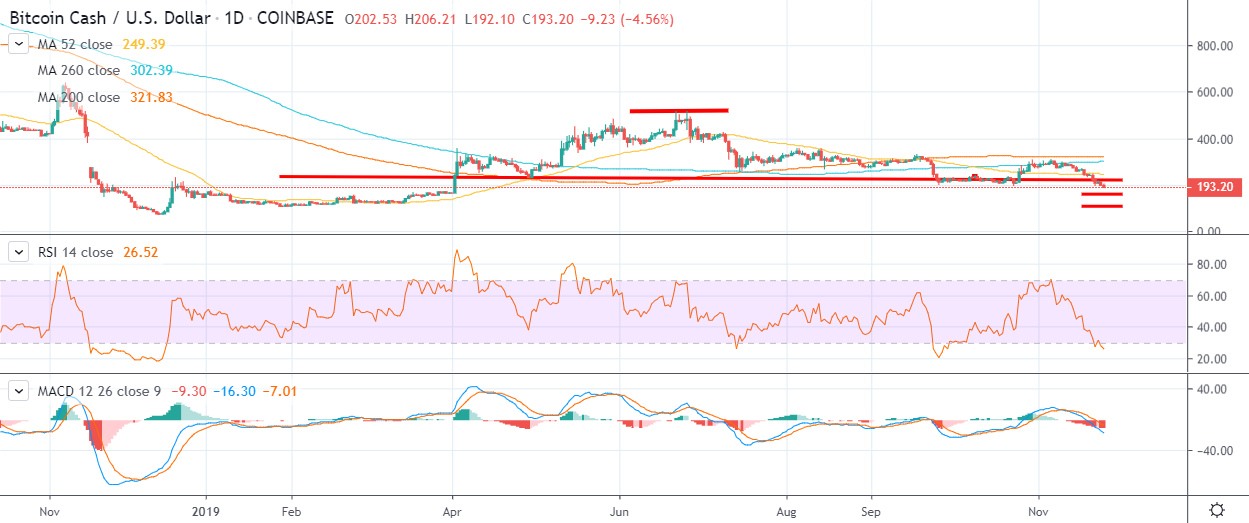
- The daily time frame shows that a bearish head and shoulders pattern has been triggered
Bitcoin Cash is under tremendous downside pressure below the $200.00 support level as the new trading week begins. The BCH/USD pair is following the broader cryptocurrency market in its move lower.
The BCH/USD pair had recently provided hints that a technical breakout was on the horizon, as the cryptocurrency consolidated inside a large trading range.
The recent bearish breakout below the $268.00 support level confirmed that the short-term direction bias of the cryptocurrency was going to be lower, and subsequently sparked a decline in the BCH/USD of over 25%.
The technicals for Bitcoin Cash are currently showing that the cryptocurrency has reached critical technical support and a potential reversal point.
The four-hour time frame that the BCH/USD pair has tested the top of a falling wedge pattern, around the $194.00 level. If trendline support in this area holds the BCH/USD pair could reverse towards the $300.00 level.
A decline back under the falling wedge pattern would be extremely bearish for the BCH/USD pair and could trigger the next wave of selling in the cryptocurrency.
The daily time frame shows that a large head and shoulders pattern has been triggered, with the BCH/USD pair remaining vulnerable to further losses while trading below the neckline of the pattern, at $225.00.
The bearish target of the head and shoulders pattern extend well below the $100.00 level. Near-term bearish targets are found at the $160.00 and $115.00 level.
According to the latest sentiment data from TheTIE.io, the short-term sentiment towards Bitcoin Cash is bearish, at 47.00 %, while the overall long-term sentiment towards the cryptocurrency is neutral, at 48.00%.
Upside Potential
The four-hour time frame shows that key technical resistance is located at the $225.00 and $268.00 levels. Buyers ideally need to rally price above the $225.00 level to stabilize the cryptocurrency.
Key technical resistance over the medium-term is located at the $280.00 and $300.00 levels.
Downside Potential
The four-hour time frame is showing that the BCH/USD pair has medium-term technical support around the $194.00 and $160.00 levels.
Critical long-term technical support for the BCH/USD pair is located at the $105.00 and $72.00 levels.
Summary
Bitcoin Cash has suffered a heavy decline after moving under the $268.00 support level and performing a short-term range break.
The BCH/USD pair needs to bounce from the $194.00 level, or it could be at risk of further double-digit losses.