
Bitcoin Cash Price Analysis BCH / USD: Defining Moment
BCH is yet to decide its next move.
- Bitcoin Cash has a bullish short-term bias and a bearish medium-term trading outlook
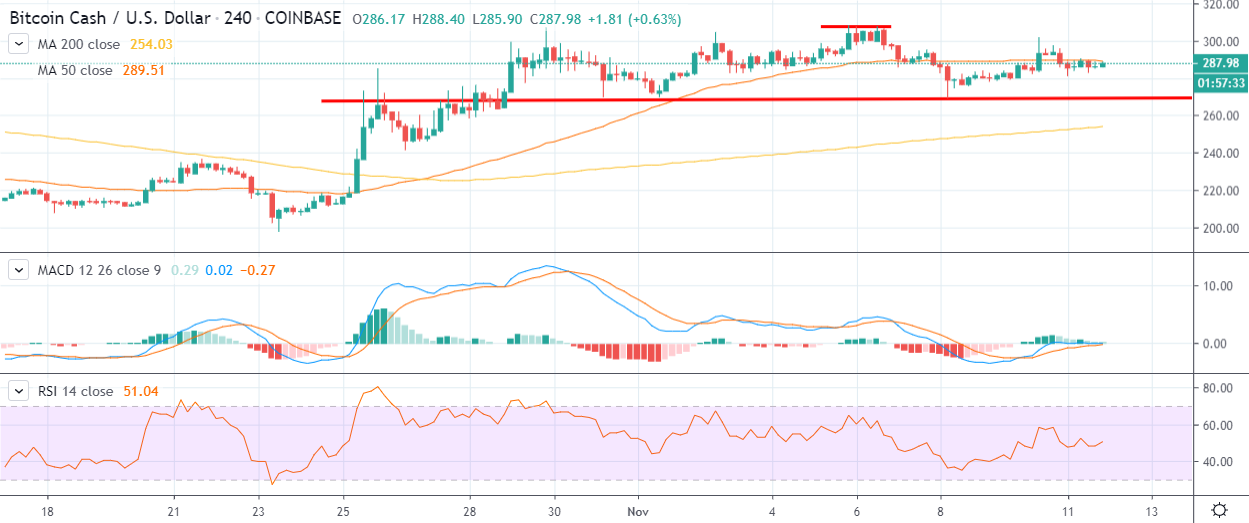
- The four-hour time frame shows that a head and shoulders pattern has formed
- The daily time frame is showing that a neutral wedge pattern has formed
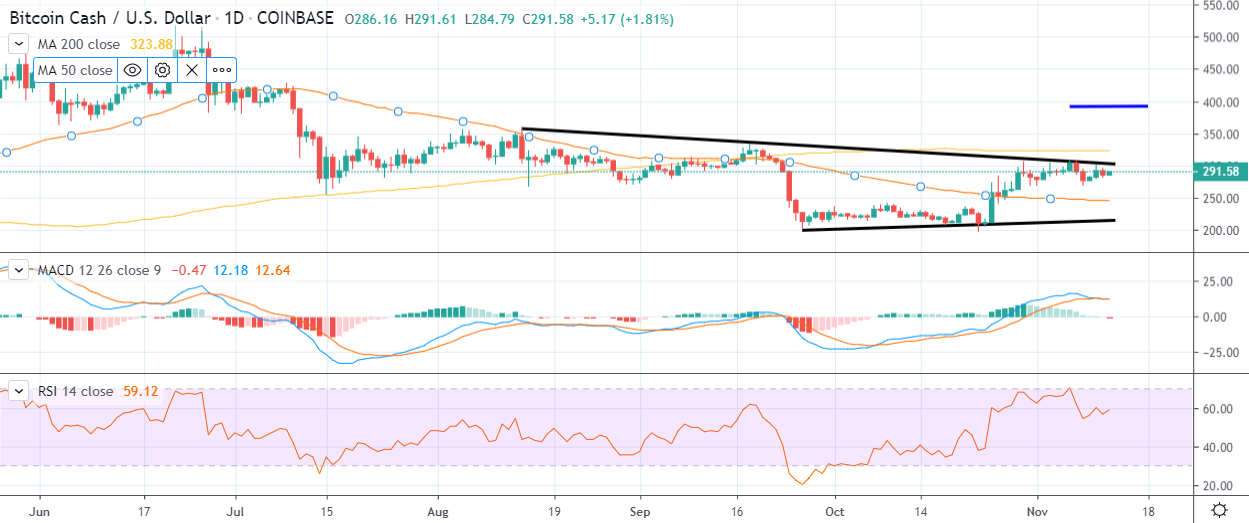
Bitcoin Cash has been on a wild ride since mid-September, with the BCH / USD pair quickly reversing from the $330.00 level towards the $197.00 level and then recovering back towards the $300.00 level.
The BCH / USD pair is currently consolidating around the $290.00 level before deciding its next directional move. At present, Bitcoin Cash trades around forty-five percent higher since October 23rd and trades around two percent in the green for the month of November.
With the broader market still in bear mode, a correction could be on the horizon for the BCH / USD pair, however, the cryptocurrency has been remarkably resilient to selling pressure this month.
Short-term analysis suggests that if buyers can secure gains above the $305.00 level then the BCH / USD pair could stage a powerful rally towards the $390.00 level.
Looking at the bear case, a head and shoulders pattern with a $30.00 downside projection has taken shape on the four-hour time frame. For the decline to take place BCH / USD sellers would need to hold price below the $270.00 level.
Medium-term analysis shows that the BCH / USD pair is trading within a wedge pattern, with the wedge pattern showing a large trading band spanning from $215.00 to $305.00.
Overall, a breakout above the $305.00 could provoke a rally towards the $390.00 level, while a decline under the $270.00 level could trigger a decline back towards the $240.00 level.
According to the latest sentiment data from TheTIE.io, the short-term sentiment towards Bitcoin Cash, at 78.00 %, while the overall long-term sentiment towards the cryptocurrency is neutral, at 48.00%.
Upside Potential
The four-hour time frame shows that a head and shoulders pattern has formed, with the BCH / USD pair likely to rally towards $335.00 level if the pattern is invalidated.
Key technical resistance for the BCH / USD pair above the $305.00 level is currently located at the $325.00 and $390.00 levels.
Downside Potential
The four-hour time frame is showing that the BCH / USD pair has formed a bearish head and shoulders pattern, with the neckline of the pattern located at the $270.00 level.
The daily time frame shows that key technical support below the $270.00 level is located at the $245.00 and $215.00 level.
Summary
Bitcoin Cash is currently trading sideways, as traders await its next directional move to unfold.
Strength above the $305.00 level could provoke a bullish rally which could see the BCH / USD advancing towards the $390.00 level.
Check out our coin guide for Bitcoin Cash.