
Shutterstock cover by TY Lim
Bitcoin, Ethereum Flash Buy Signals on Low Liquidity
Bitcoin and Ethereum are trading tentatively while one particular technical indicator points to a rebound.
Bitcoin and Ethereum have incurred significant losses over the past month and appear to have reached oversold territory. Although buy signals are starting to appear, it is reasonable to wait for confirmation given the lack of trading volume.
Bitcoin, Ethereum at Key Support
Bitcoin and Ethereum are presenting buy signals while trading at a critical support zone.
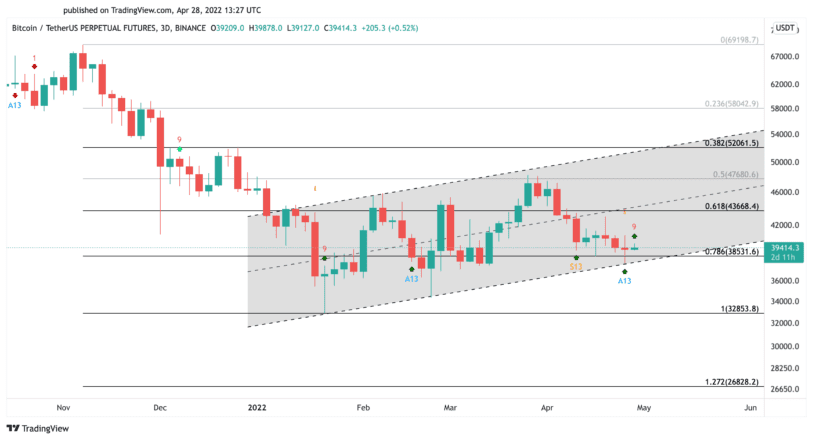
The flagship cryptocurrency has retraced by nearly 22% over the past month, going from a high of $48,223 to hit a low of $37,693 recently. Despite the brief dip below the 78.6% Fibonacci retracement level at $38,530, it appears this support area was able to hold. Further signs of strength around the current price levels could lead to a sustained bullish impulse.
The Tom DeMark (TD) Sequential indicator anticipates that sidelined investors might take advantage of the recent correction to re-enter the market and help BTC rebound. This technical index has presented a buy signal on Bitcoin’s three-day chart, which is indicative of a one to four candlesticks upswing.
If Bitcoin can stay above the $38,530 support level, it would likely collect the liquidity to validate the optimistic outlook and rebound toward $43,670 or even $52,000.
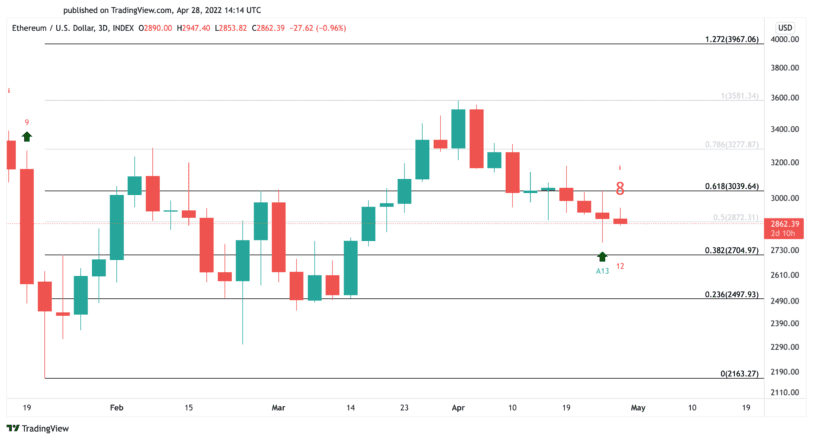
Ethereum has also incurred significant losses over the past month. Since early April, it retraced by nearly 23%, losing more than 800 points in market value. The second-largest cryptocurrency by market cap now appears to be approaching a crucial demand zone that may help it rebound.
The TD setup has already flashed a buy signal in the form of an aggressive 13 on ETH’s three-day chart, while a red nine candle would likely develop in the next three-day trading session. These bullish formations anticipate that momentum is building for an upswing. Still, Ethereum could dip to $2,700 before it rebounds.
Only a decisive three-day candlestick close above $3,000 can confirm the optimistic outlook. If this were to happen, sidelined investors could be encouraged to re-enter the market, pushing Ethereum to $3,600 or even $4,000.
Although a few buy signals are starting to appear after the steep correction Bitcoin and Ethereum saw over the past month, the lack of trading volume seen in the last few days suggests that retail investors are not interested in entering the market at the current price levels.
If buy orders do not pick up soon, BTC could breach the $38,530 support and fall to $32,850 or $26,830 while ETH might dip below $2,700 and target $2,500 or even $2,160.
Disclosure: At the time of writing, the author of this piece owned ETH and BTC.