Bitcoin, Ethereum Jump After U.S. Jobs Report
The U.S. Labor Department's jobs report revealed that employment stayed solid in August.

Key Takeaways
- The U.S. labor market remained robust in August despite growing economic concerns.
- Bitcoin and Ethereum posted moved higher on Friday following the report.
- Still, both cryptocurrencies remain in a bearish posture from a long-term perspective.
Share this article
Bitcoin and Ethereum appear to be edging closer to a major price movement as investors’ sentiment improves following the latest U.S. labor report.
Make-Or-Break for Bitcoin and Ethereum
Bitcoin and Ethereum have experienced a small boost after the latest U.S. Labor Department report revealed that employment stayed solid in August.
Job growth in the U.S. slowed down in August but remained strong despite economic concerns and rising fears of recession. The Labor Department report revealed that employers added 315,000 jobs over the past month. The U.S. unemployment rate increased to 3.7% from 3.5% in July, slightly higher than expectations.
The data released Friday appears to have been welcomed by investors. Bitcoin has recorded a price increase of around 2% while Ethereum has pulled out ahead registering a 5% gain at press time. Despite the recent jump, technical factors still point to a steeper correction in the near future.
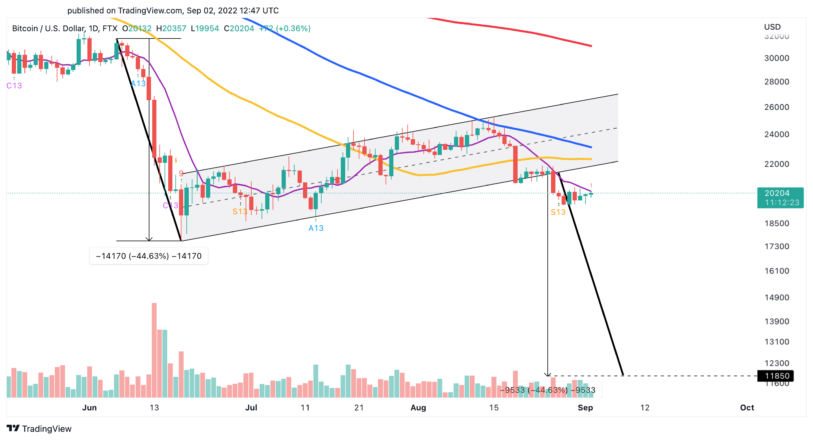
Bitcoin appears to have broken out of a bear flag on August 26. This technical formation anticipates a spike in sell pressure could push BTC into a 44.6% correction toward $11,850. Despite the pessimistic outlook, the top cryptocurrency looks primed for a small rebound before it hits a lower low.
A decisive daily candlestick close above the 10-day moving average at $20,340 may give Bitcoin the strength to rise toward the 50-day moving average at $22,000.
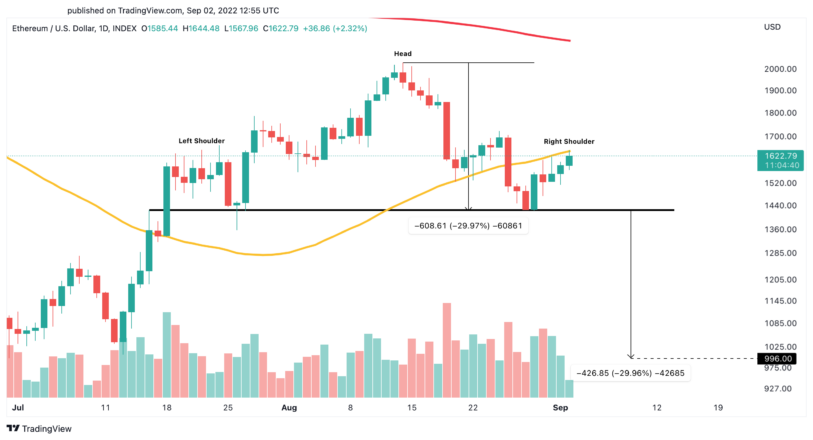
Ethereum also appears to be developing a bearish technical formation on its daily chart. ETH could be forming the right shoulder of a head-and-shoulders pattern. A rejection from the 50-day moving average at $1,650 could increase the odds of a steeper correction in the near future.
If this were to happen and Ethereum dips below the $1,430 support level, a 30% correction to $1,000 becomes a strong possibility. For ETH to advance higher, it must slice through the 50-day moving average to invalidate this bearish thesis. Doing so could induce a surge toward its 200-day moving average at $2,100.
Given Bitcoin and Ethereum’s ambiguity, it is imperative to wait for a decisive close above support or below resistance before trying to time their next major price movements.
Disclosure: At the time of writing, the author of this piece owned BTC and ETH.
Share this article
