Bitcoin, Ethereum Poised to Retrace Before Further Gains
Bitcoin and Ethereum are up more than 10% in the past four days, suggesting that a spike in profit-taking might be near.

Key Takeaways
- Bitcoin is aiming to resume its uptrend but faces stiff resistance at $48,500.
- Ethereum must break through $3,500 to advance further.
- The emergence of sell signals on BTC and ETH’s 12-hour charts suggests that the assets could face a correction before higher highs.
Share this article
Bitcoin and Ethereum have flashed sell signals after posting significant gains. Although the bearish formations have proven accurate in the past, heightened buying pressure could quickly invalidate the short-term pessimistic outlook and lead to higher highs.
Bitcoin Trades in Tight Range
Bitcoin and Ethereum could be facing a correction.
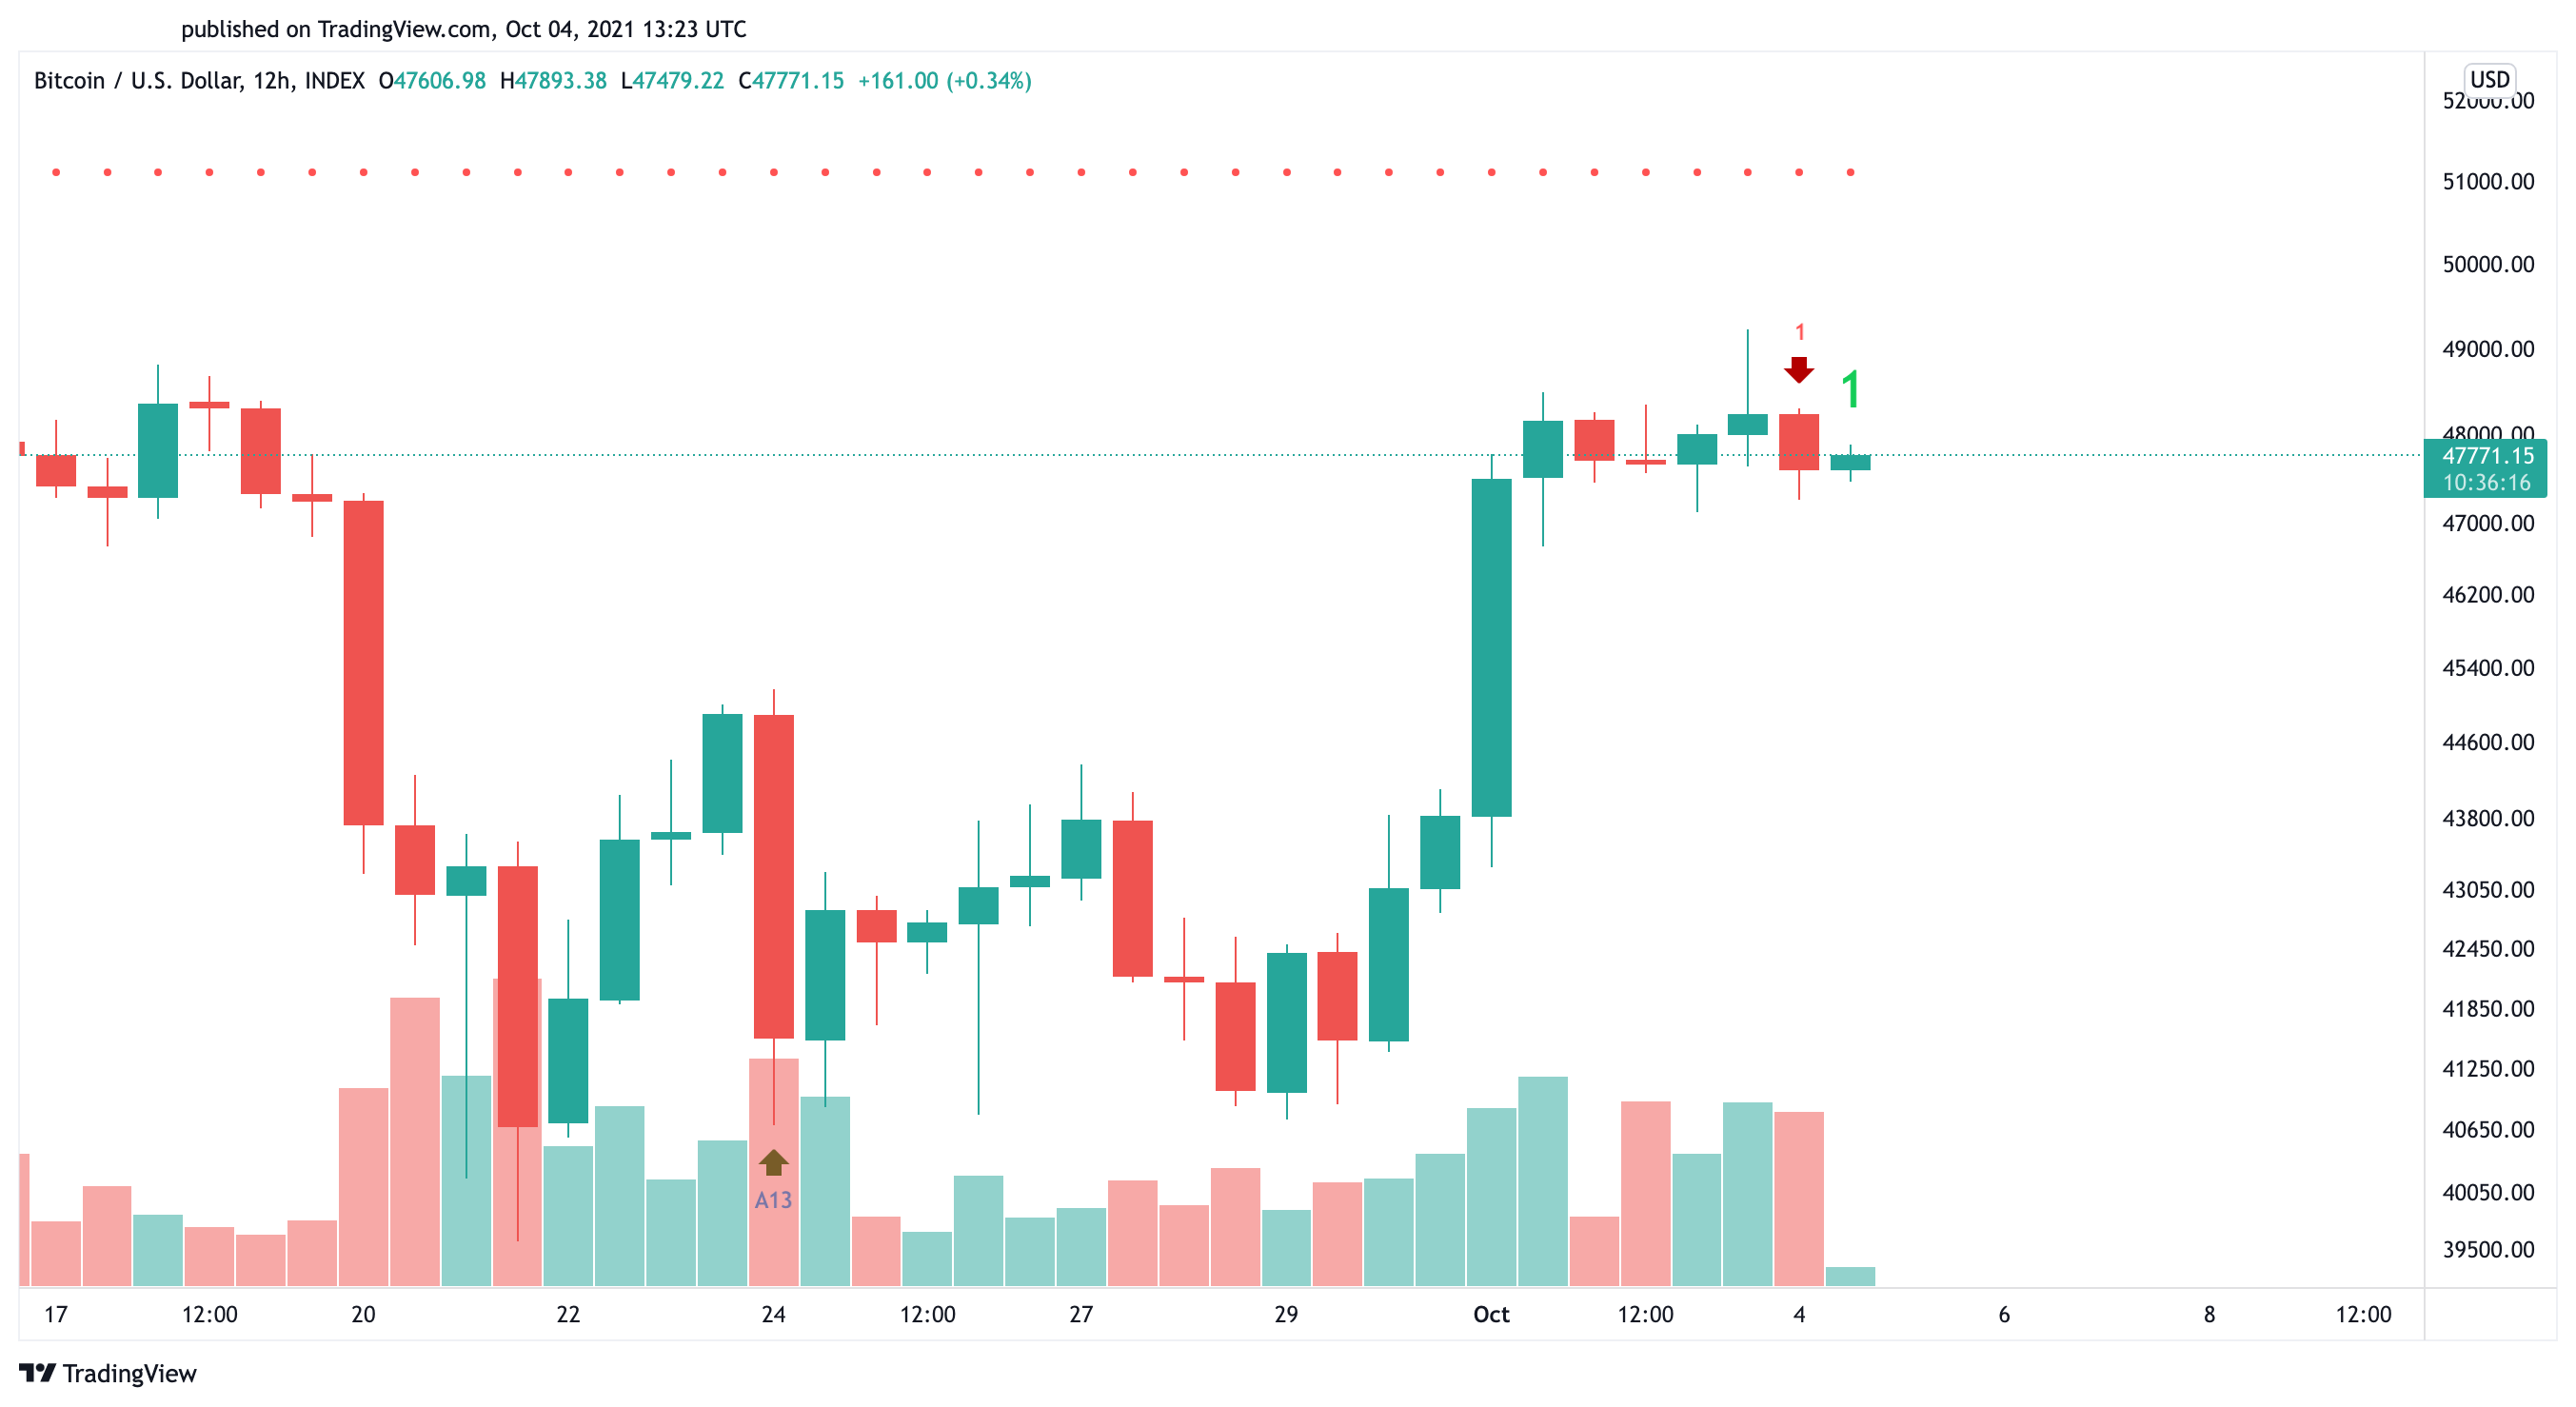
Bitcoin appears to have slowed down its momentum after the 12% price upswing it experienced on Oct. 1. The leading cryptocurrency has been consolidating within a tight range since then. The $48,500 resistance level is preventing BTC from advancing further, while the $47,500 support is containing any spike in selling pressure.
While a decisive 12-hour candlestick close outside this price pocket should determine where Bitcoin will head next, one technical indicator is anticipating a correction before higher highs.
The Tom DeMark (TD) Sequential indicator has presented a sell signal on BTC’s 12-hour chart. The bearish formation developed in the form of a green nine candlestick, anticipating a one to four 12-hour candlestick retracement.
IntoTheBlock’s In/Out of the Money Around Price (IOMAP) model shows that Bitcoin’s downside potential could be capped at $45,700. Transaction history reveals that more than 1.11 million addresses have previously purchased 590,000 BTC around this price level.
Such a significant interest area may have the ability to absorb any increase in downward pressure. Holders who have been in the green may attempt to prevent their investments from going “Out of the Money,” slowing down the uptrend.
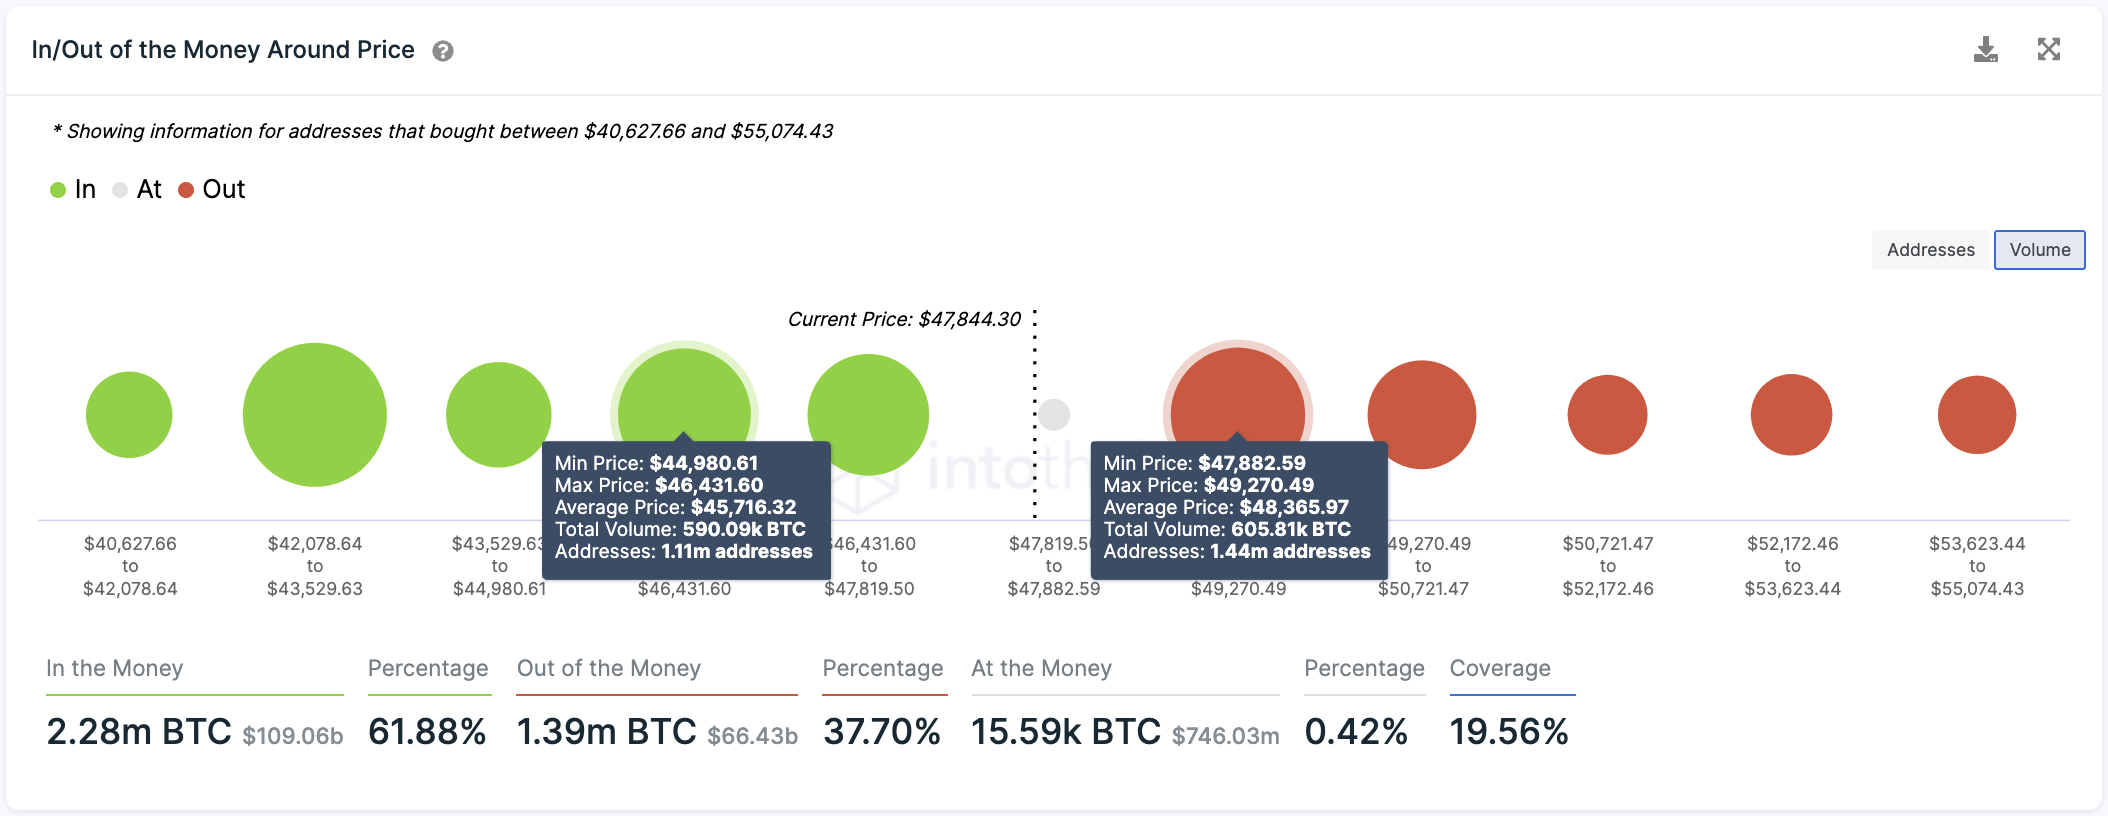
On the other hand, the IOMAP cohorts show that Bitcoin is facing stiff resistance ahead. Over 1.44 million addresses purchased roughly 605,000 BTC between $47,900 and $49,270. A clear break of this supply barrier could invalidate the TD’s sell signal, pushing the pioneer cryptocurrency to $52,000 or higher.
Ethereum Could Tests the Bulls
Ethereum has also enjoyed bullish price action since the new monthly open. The second-largest cryptocurrency by market cap has gained over 500 points in market value to hit $3,500.
Due to the significant gains it has recently posted, the TD Sequential indicators suggest that an increase in profit-taking might be under way. This technical index has presented a sell signal in the form of a green nine candlestick on ETH’s 12-hour chart. The bearish formation forecasts a one to four 12-hour candlesticks correction before the uptrend can resume.
A spike in selling pressure could push Ethereum toward 38.2% or 23.6% Fibonacci retracement levels. These critical areas of support sit at $3,200 and $3,040 respectively.
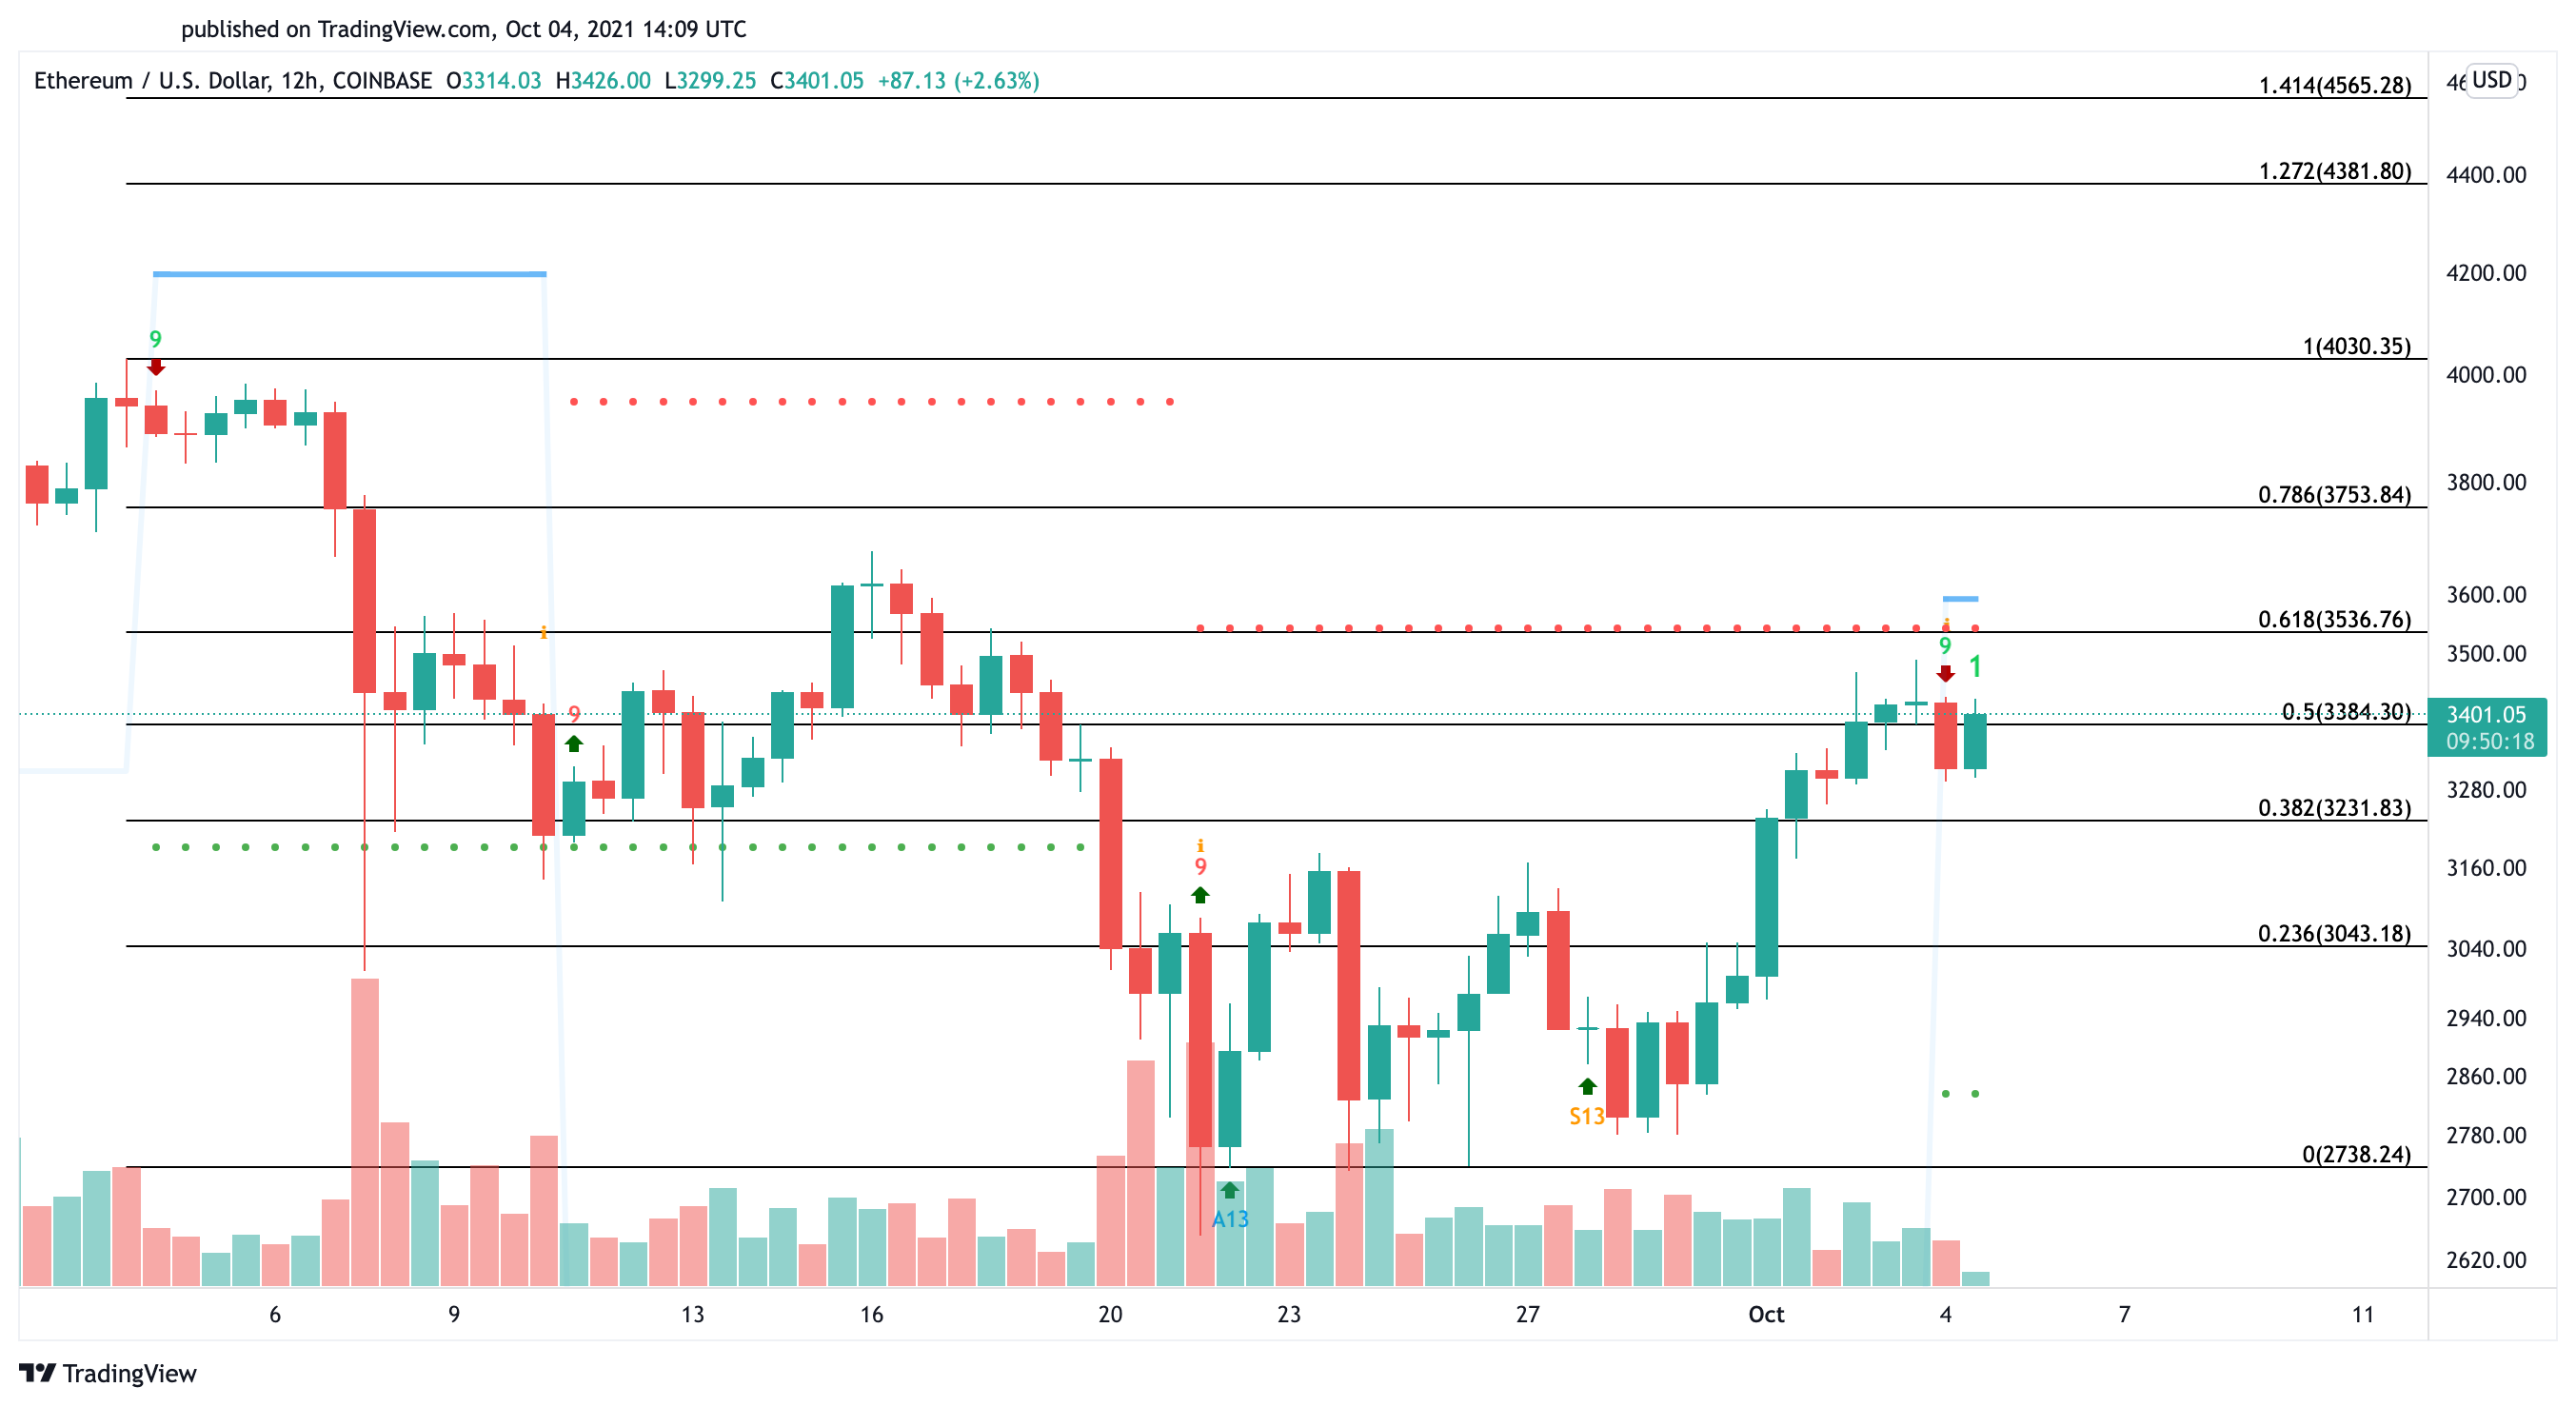
While the data suggests that Ethereum could suffer a significant dip, it may have a chance to invalidate the TD’s sell signal and advance further. A decisive 12-hour candlestick close above the setup trendline and the 61.8% Fibonacci retracement level at $3,500 could encourage investors to buy more ETH. Once this resistance level is breached, a steady increase in buy orders could be significant enough to push ETH to $4,000 or even $4,400.
Share this article
