Bitcoin, Ethereum Show Ambiguity After Volatile Start to the Week
Bitcoin and Ethereum appear to be positioned for a significant price movement as both tokens approach areas of support.

Key Takeaways
- Bitcoin and Ethereum retraced after having a positive start to the week.
- To define its trend, BTC needs to close outside the $24,700-$23,460 range.
- Meanwhile, Ethereum needs to hold above $1,850 to avoid a brutal correction.
Share this article
Nearly $161 million in long and short positions have been liquidated across the cryptocurrency market in the past 12 hours. The spike in volatility has pushed Bitcoin and Ethereum towards crucial areas of support that will likely define the direction of the trend.
Bitcoin and Ethereum Consolidate
Bitcoin and Ethereum are stuck within narrow trading ranges, showing ambiguity until support or resistance breaks.
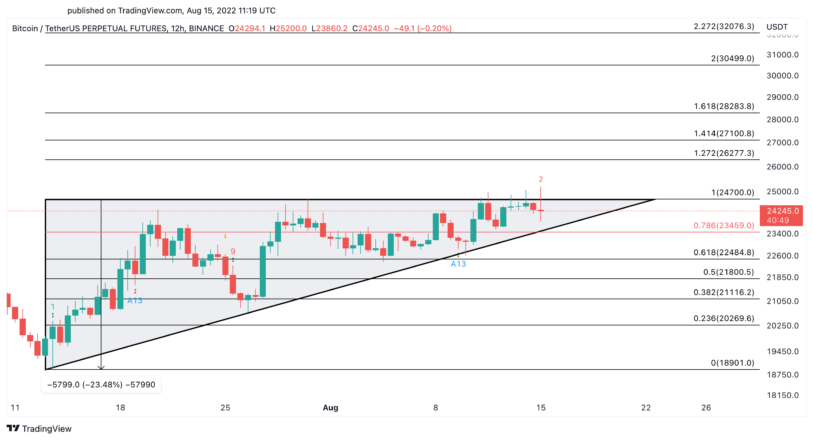
Bitcoin started Monday’s trading session on a positive note, surging nearly 4%. The early gains were short-lived as a spike in profit-taking pushed BTC from an intraday high of $25,200 to a low of $23,900. Despite the volatility spike, it is unclear where the pioneer cryptocurrency could be heading next.
From a technical perspective, Bitcoin appears to have developed an ascending triangle on its 12-hour chart. This consolidation pattern prevails that a sustained close outside the $24,700 to $23,460 price range could trigger a 23.5% move. This target derives from the height of the triangle’s Y-axis.
If BTC can print a 12-hour candlestick close above $24,700, an upswing to $30,500 can be expected. However, a downswing below $23,460 can trigger a sell-off to $19,000.
Ethereum also underwent a 5.6% retracement shortly after Monday’s trading session opened. The downswing was caused by a rejection from the upper trendline of a rising wedge developing on ETH’s 12-hour chart. The technical formation anticipates that if prices close below the lower trendline at $1,850, a 26.7% downswing to $1,350 becomes imminent.
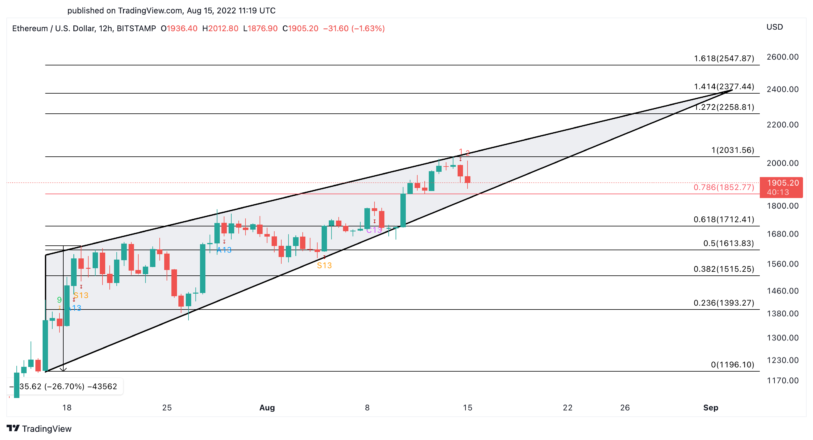
It is worth noting that Ethereum would have to close decisively above $2,030 to invalidate the pessimistic outlook. Slicing through this resistance barrier could be seen as a sign of strength that encourages sidelined traders to re-open long positions, triggering a breakout toward $2,550.
Disclosure: At the time of writing, the author of this piece owned BTC and ETH.
Share this article
