Bitcoin, Ethereum Tumble After Breaching Critical Support
Bitcoin and Ethereum appear oversold, but macroeconomic fears could prevent a significant rebound.

Key Takeaways
- Bitcoin dropped 11.6% following Monday’s open.
- At the same time, Ethereum took an 18% nosedive.
- Both cryptocurrencies now sit at crucial support levels.
Share this article
The total cryptocurrency market cap has fallen below $1 trillion for the first time since January 2021 as Bitcoin, Ethereum, and most major cryptocurrencies drop in tandem.
Bitcoin and Ethereum Look Oversold
Bitcoin and Ethereum appear to have resumed their downtrends after losing vital support areas.
Bitcoin has seen its price drop by nearly 11.6% following Monday’s open. BTC went from $26,565 to hit a low of $23,426, losing more than 3,000 points in market value. The recent bout of selling has put Bitcoin in oversold territory, opening up the possibility of a rebound.
The Tom DeMark (TD) Sequential indicator currently presents a buy signal on Bitcoin’s four-hour chart. The bullish formation is indicative of a one to four candlesticks upswing. A spike in buying pressure at the current price levels could help validate this bullish formation.
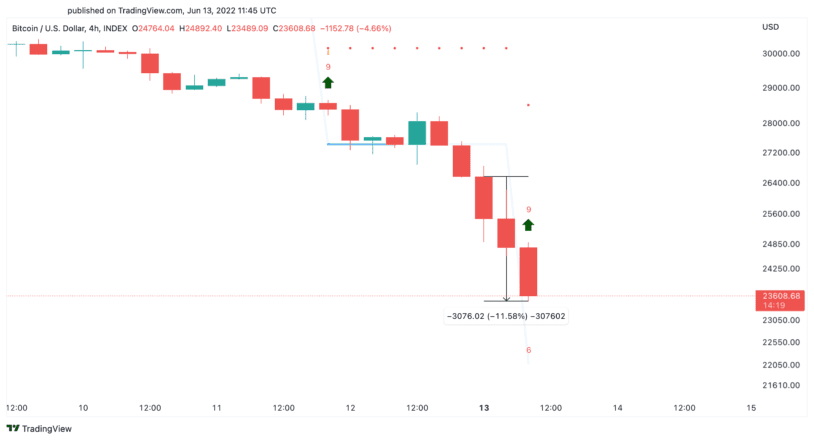
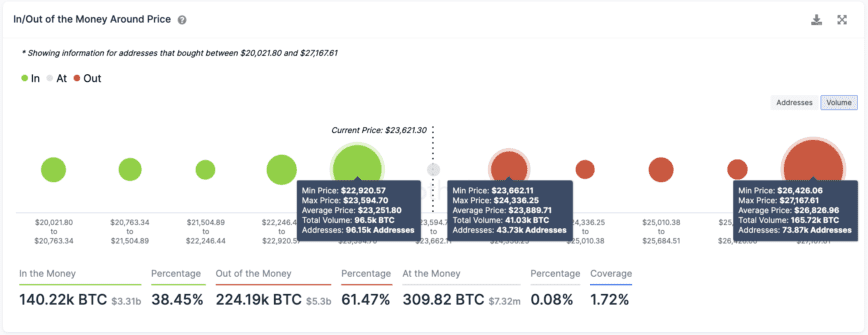
On-chain data shows that roughly 96,000 addresses have previously purchased nearly 100,000 BTC between $22,920 and $23,600. If Bitcoin can hold above this level, the TD’s outlook could be confirmed and lead to a rebound toward $27,000. Still, the pioneer cryptocurrency must reclaim $24,000 first as support to entice market participants into opening new long positions.
It is worth noting that losing the $22,920 to $23,600 support floor could result in a downswing to $20,000 as there appear to be no other prominent areas of demand underneath it.
Ethereum also kicked off the week in a negative posture, dropping nearly 18% since Monday’s open. The downtrend appears to have accelerated shortly after ETH broke out of a descending triangle pattern on the four-hour chart. The recent fall has brought ETH down to the 29.4% target presented by the bearish technical formation.
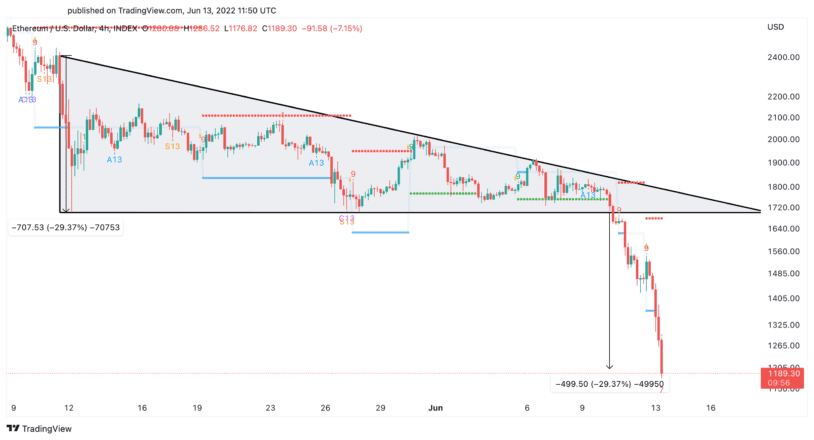
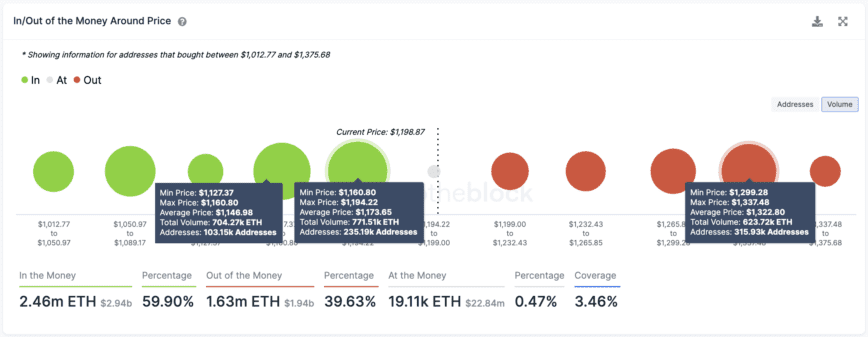
Transaction history shows that the area between $1,130 and $1,190 represents a significant support floor for Ethereum. Here, approximately 340,000 addresses have previously purchased 1.44 million ETH. If prices can hold above this demand zone, a rebound toward $1,330 could materialize.
The strength of the downward move suggests that despite the importance of the $1,130 to $1,190 support, it is vital to wait for confirmation before anticipating a potential rebound. Losing this support could result in a downswing to $1,000 or even $900.
It’s still not clear whether Bitcoin and Ethereum can gain the strength needed to rebound. The macroeconomic environment remains bearish given the looming uncertainty in the global financial markets. May’s CPI data revealed that U.S. inflation is at 8.6%, hitting a 41-year high and significantly exceeding economists’ expectations.
Disclosure: At the time of writing, the author of this piece owned BTC and ETH.
Share this article
