
Bitcoin, Ethereum, and XRP Open Markets With a Bang, More to Come
The top three cryptocurrencies by market cap have enjoyed a significant rally over the past few hours despite the growing uncertainty in the markets.
The cryptocurrency market kicked off the week with an explosive start, as investors injected $7 billion since the weekly candlestick open. The cash flood pumped Bitcoin, Ethereum, and XRP. Different metrics also show these top token are just getting started.
Bitcoin Holders Continue Accumulating
Ever since the halving, the flagship cryptocurrency has been in a stagnation phase with no clear roadmap moving ahead.
Bitcoin has mostly traded between the 50% and 38.2% Fibonacci retracement levels in the past two months — when measured from the peak of late June 2019 of nearly $14,000 to mid-March’s swing low of $4,000.
A clear daily candlestick close below or above these essential support and resistance levels will determine the trend’s direction.
Despite the lackluster price action, investors remain optimistic about what the future holds. This sense of “optimism” can be seen on Glassnode’s “Net Unrealized Profit/Loss” index as well in the growing number of Bitcoin “hodlers.”
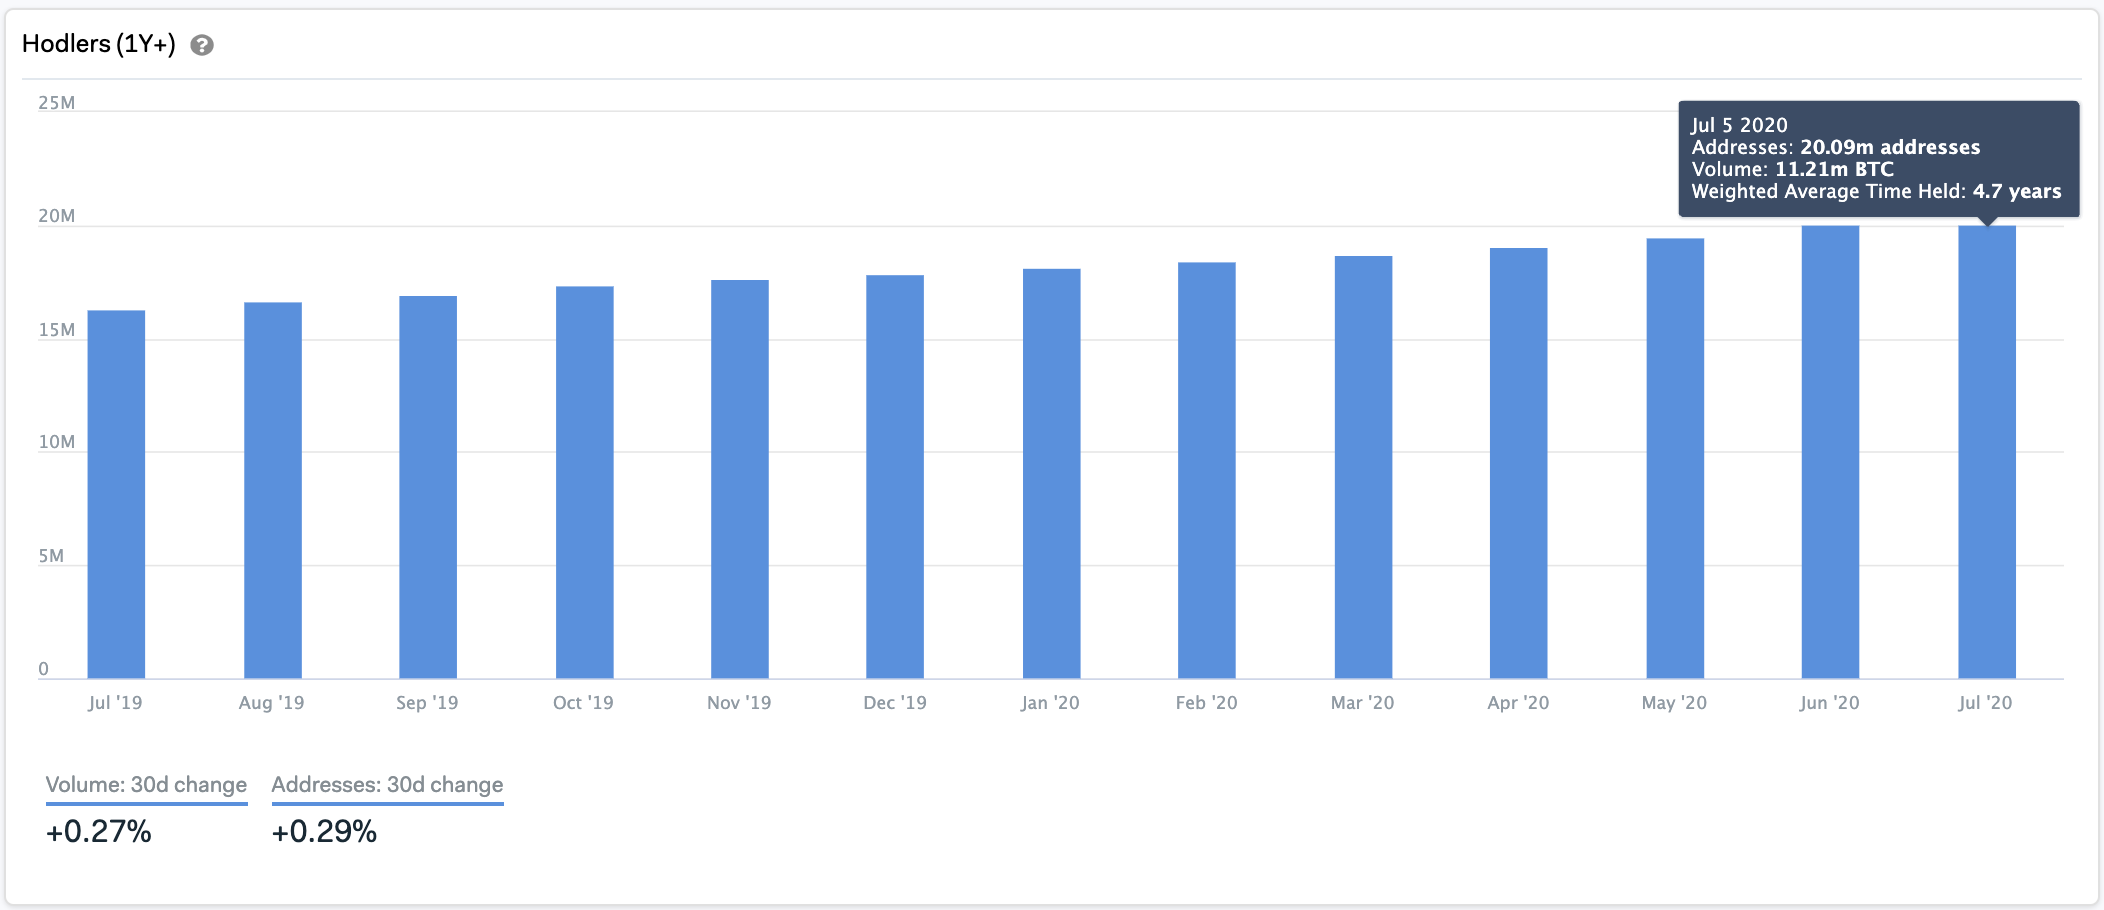
In a recent blog post, Daniel Ferraro, Marketing Director at IntoTheBlock, affirmed that the number of addresses holding BTC for more than one year has been steadily increasing over the past twelve months.
This figure has continued to climb during March’s market meltdown.
“The number [of Bitcoin ‘hodlers’] reached 20 million, or roughly two-thirds of all addresses with a balance. Similarly, approximately 60% of the circulating supply of Bitcoin is held by these addresses with an average time held of 4.7 years,” said Ferraro.
Alongside the keen interest among investors, the TD sequential indicator adds credence to the bullish outlook.
This technical index is currently presenting a buy signal in the form of a red nine candlestick on BTC’s 3-day chart. The bullish formation estimates a one to four candlesticks upswing or the beginning of a new upward countdown.
Based on the price action over the last two months, BTC could be preparing to surge towards the 38.2% Fibonacci retracement level and the setup trendline that sits around $10,000.
Moving past this resistance would likely entice other market participants to pile in and propel Bitcoin to $11,500.
It is worth noting that losing the 50% Fibonacci retracement level as support would likely invalidate the scenario presented by the TD setup.
If this were to happen, Bitcoin might test the 61.8% Fibonacci retracement level before achieving its upside potential.
Ethereum Utility Surges and Prices May Follow
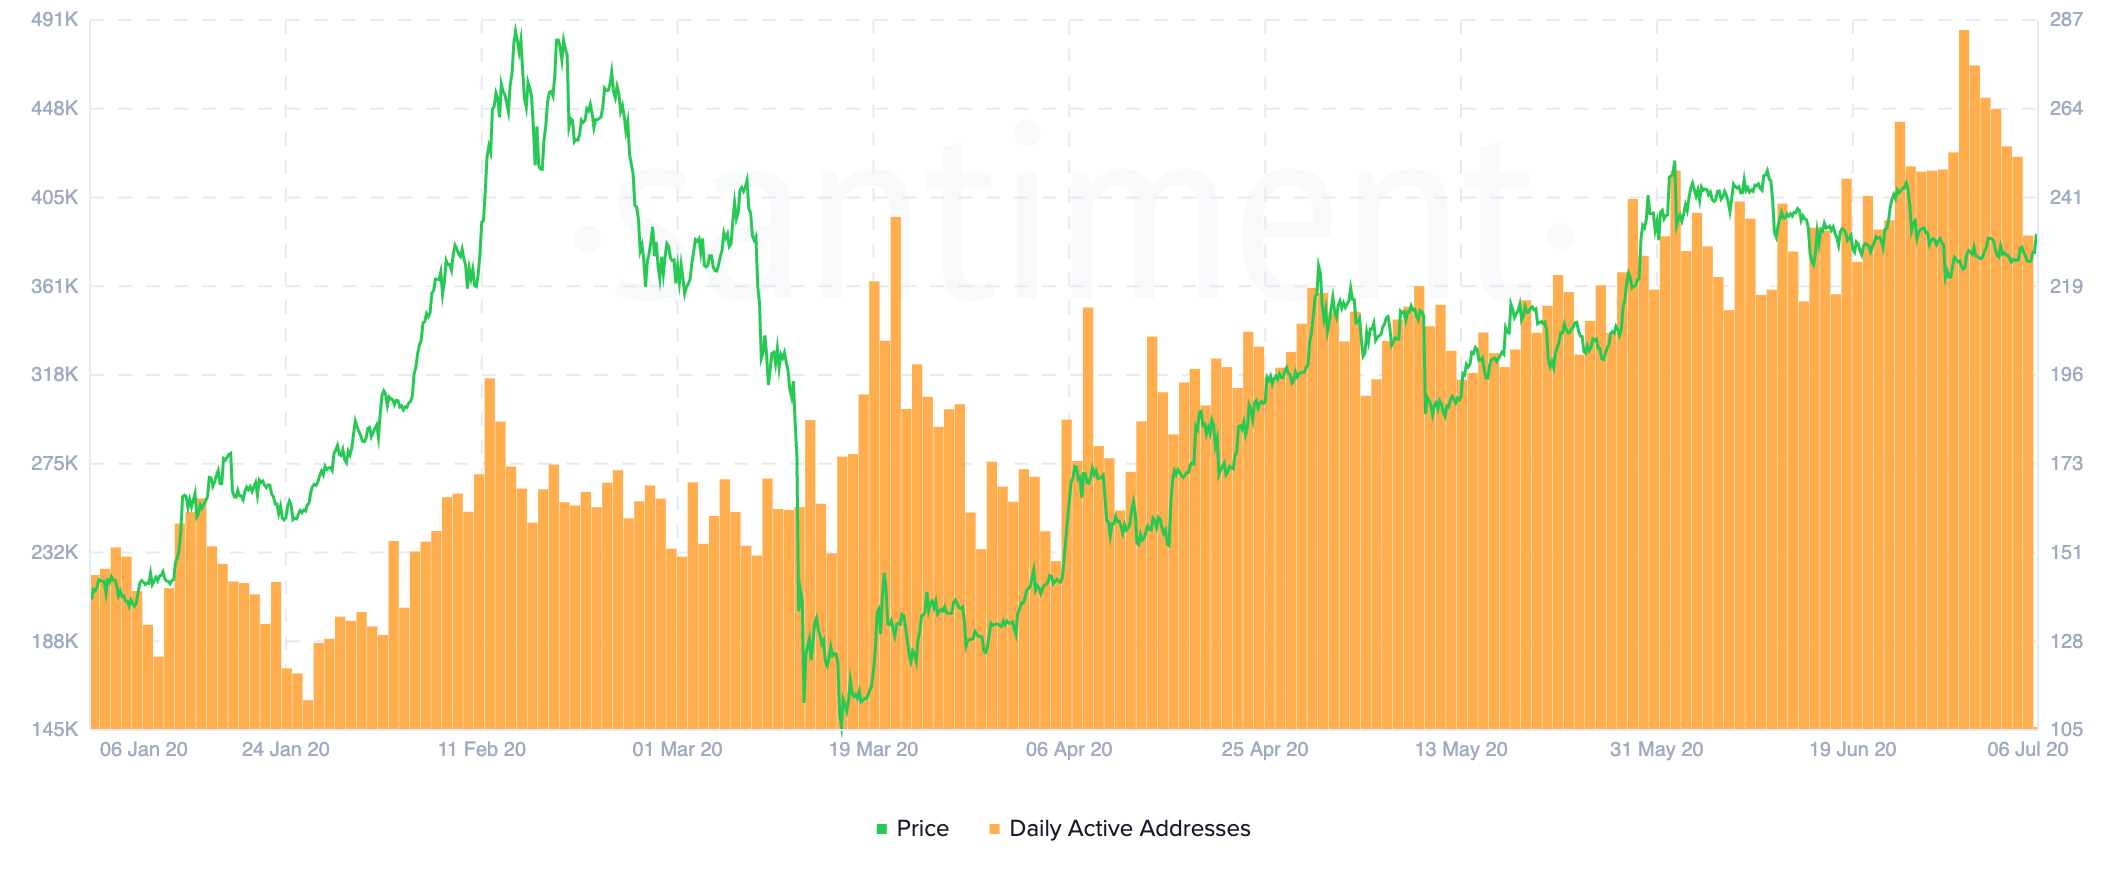
Ethereum’s utility continues to grow. Its network activity recently reached levels not seen in the last two years amid the yield farming and DeFi boom.
Data from Santiment reveals that the number of daily active ETH addresses surged to nearly 500,000 addresses. Meanwhile, the number of Ether transactions surpassed the 1 million transactions milestone on June 23, according to IntoTheBlock.
Despite users flocking to the Ethereum network, its price continues consolidating within a descending parallel channel that began to take shape in early June.
Since then, each time the smart contracts giant rises to the upper boundary of the channel, it gets rejected by this hurdle and pulls back to the middle or the bottom. From this point, it tends to bounce back towards resistance, which is consistent with the characteristics of this technical formation.
Following the retest of the lower boundary of the descending parallel channel on Jun. 27, Ether appears to be on its way up to the upper boundary that sits at $240.
Here, IntoTheBlock’s “In/Out of the Money Around Price” (IMOAP) model reveals that roughly 1.3 million addresses had previously purchased over 6 million ETH.
Such a significant supply barrier may prevent Ethereum from advancing further as holders within this range will likely try to break even in the event of a bullish impulse.
Under such circumstances, it is reasonable to expect a move back to the middle or bottom of the parallel channel based on the past month’s price history.
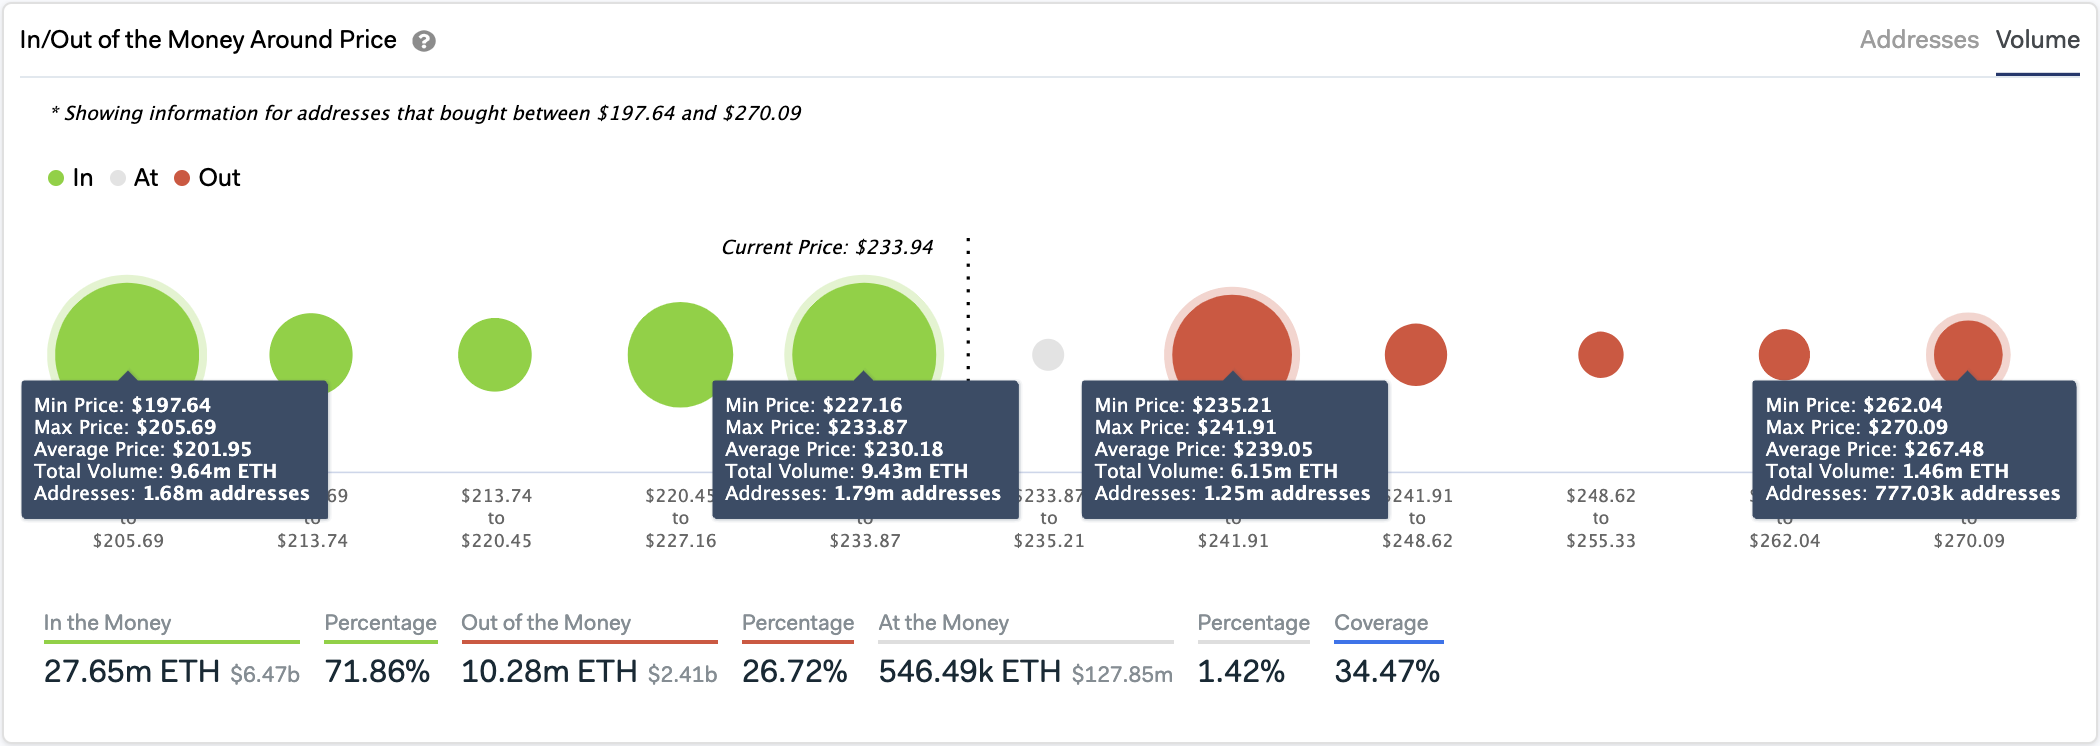
Nonetheless, breaking above the $240 resistance cluster might see Ethereum rise towards $270.
The IOMAP cohorts show that there isn’t any considerable supply wall in-between these price points that will prevent such an upswing.
XRP Flashes A Buy Signal
Ripple’s XRP recently lost a significant support level that has been holding its price since early May. The downswing was followed by an increase in the selling pressure behind it that pushed its price down nearly 10% to hit a low of $0.169.
On its way down, the 50% Fibonacci retracement level contained the downward pressure, and now the cross-border remittances token seems poised to rebound.
The TD sequential indicator supports the optimistic view since it is currently presenting a buy signal on XRP’s 3-day chart.
The bullish formation developed in the form of a red nine candlestick, but this formation transitioned into a green one candlestick due to the recent price action.
A further increase in buy orders behind XRP could help validate the buy signal, which may lead to a one to four candlestick upswing or the beginning of a new upward countdown. Regaining the 38.2% Fibonacci retracement level as support can be used as confirmation of further gains to come.
Even though the odds seem to favor the bulls, investors mush watch out for a 3-day candlestick close above the 38.2% Fibonacci retracement level. Failing to do so could see XRP plummet towards the 50% Fibonacci retracement level once again.
The Crypto Market Moves Forward
Given the massive gains that some lower-cap tokens have posted recently and the high levels of correlation in the market, it is reasonable to believe that Bitcoin, Ethereum, and XRP are poised to advance higher.
However, investors must implement a robust risk management strategy to avoid getting caught on the wrong side of the trend.
Willy Woo is one of the many analysts who maintain that a downswing will be triggered before the market enters another bullish cycle. The on-chain chartist believes that July could be another bearish month based on a proprietary technical model.
“The longer this bull market takes to wind up, the higher the peak price. A long sideways accumulation band is ultimately a good thing,” said Woo.
While emotions run high due to the ambiguity in the markets, it is worth noting that Bitcoin’s most significant resistance barrier is the infamous $10,000 hurdle. Turning this level into a support would open the gates to a new bull market.