Bitcoin is following its past price cycles’ movements: Glassnode
The current price cycle suffered significantly less when compared to the previous three, but its recovery rate is being affected by GBTC’s outflows.
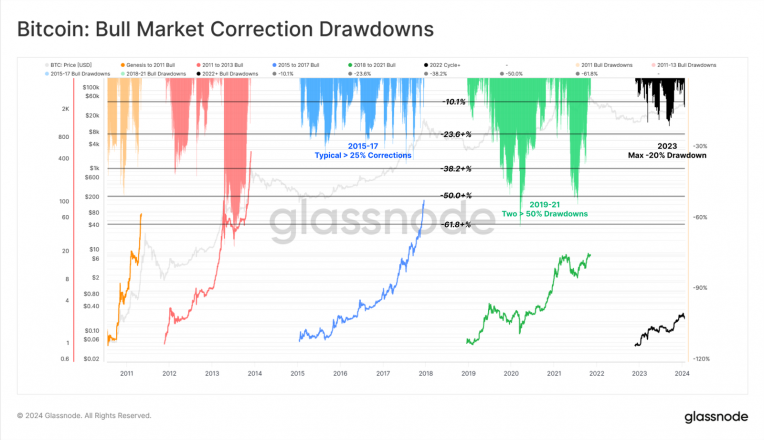
The current Bitcoin (BTC) price cycle is rhyming with the past three instances, according to a report published today by on-chain analysis firm Glassnode. The last three cycles have shown a striking similarity in their performance trends, although the current one is managing to stay slightly ahead of the 2016-17 and 2019-20 periods.
A deeper dive into the market’s behavior reveals a robust level of resilience in the current cycle. Corrections from local highs have been relatively moderate, with the most significant drawdown recorded at -20.1% in August 2023. This resilience is further highlighted when comparing the proportion of days with deeper corrections across different cycles, showcasing a decreasing trend in market volatility over time.
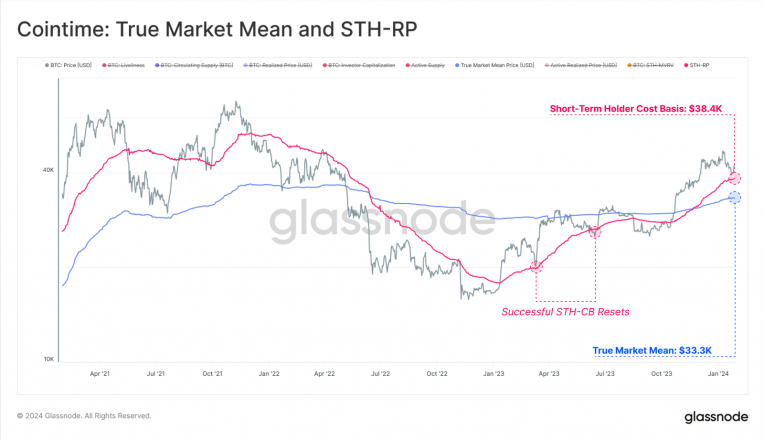
Yet, recent weeks have seen a downtrend in price momentum, influenced by the market’s adjustment to the introduction of spot Exchange-Traded Funds (ETFs) in the US. The Short-Term Holder Cost Basis, currently at $38,000, and the True Market Mean Price, at $33,000, are pivotal in understanding the market’s stance.
These metrics offer insights into the average acquisition price of new demand and a cost basis model for active investors, respectively, serving as critical indicators for market sentiment and potential shifts.
Retests of the Short-Term Holder Cost Basis as support are commonplace during uptrends, but a significant breach of this level could shift focus to the True Market Mean Price. This price level, often seen as the market’s centroid, plays a crucial role in distinguishing between bull and bear markets.
As Bitcoin navigates through these market dynamics, the interplay of resilience, investor sentiment, and new market structures like spot ETFs paints an interesting picture.
The ‘GBTC factor’
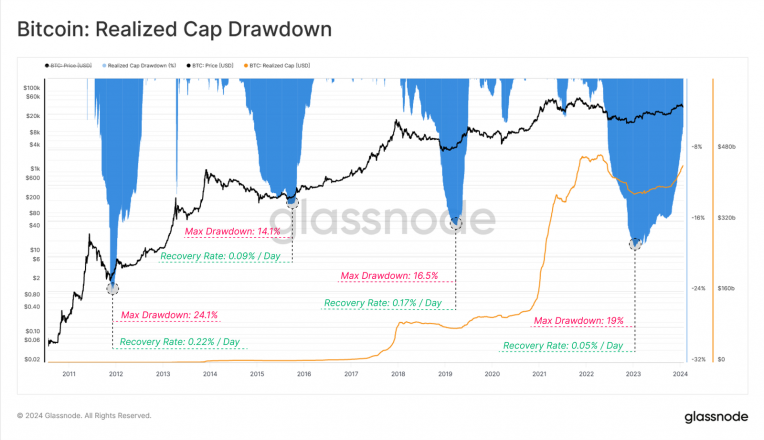
Despite the actual cycle being the one with softer corrections, it also presents the slowest recovery rate of all four price cycles so far, measured by analyzing the Realized Capitalization metric. This indicator accounts for the market value of all Bitcoins at the price they were last moved, and stands as a more accurate reflection of the network’s capital inflows and outflows than traditional market cap metrics, according to Glassnode.
Currently, Bitcoin’s Realized Cap hovers just 5.4% below its all-time high (ATH) of $467 billion, signifying robust capital inflows and a market teeming with activity. However, a closer examination reveals that the pace of recovery to previous ATH levels is markedly slower in the current 2023-24 cycle compared to its predecessors.
This slow pace can be partially attributed to significant market headwinds stemming from the Grayscale Bitcoin Trust (GBTC). GBTC, a closed-end trust fund, became a focal point in the crypto market by amassing an impressive 661,700 BTC in early 2021, as traders sought to exploit the net asset value (NAV) premium arbitrage opportunity.
For years, GBTC traded at a severe NAV discount, burdened by a high 2% management fee. This led to a complex market scenario where the trust’s conversion to a spot ETF became a catalyst for a significant rebalancing event in the market.
Since this conversion, more than 115,000 BTC have been redeemed from the GBTC ETF, exerting considerable pressure on Bitcoin’s market dynamics and influencing the Realized Cap’s recovery trajectory.


