
Bitcoin Struggles to Break Through $10,000
Despite the recent uptick BTC was soundly rejected
Despite bullish price action, it won’t be easy for Bitcoin to break above $10,000 according to these indicators.
Bitcoin Within Narrow Trading Range
Over $10 billion was injected into the crypto market today. Following the massive inflow of capital, most cryptocurrencies saw their price surge significantly, including Bitcoin’s.
In fact, the flagship cryptocurrency climbed up over 3.5% to move above the $10,000 resistance level for a short period of time. This price hurdle, however, rejected BTC from a further advance sending it back down under 1.5%.
Based on IntoTheBlock’s “In-Out of the Money Around Current Price” (IOMAP) model, the rejection seems to have been triggered by over 1.7 million addresses collectively holding more than 1.1 million BTC between $10,000 and $10,300. This major supply barrier may continue to hold until there is a spike in the buying pressure behind Bitcoin that allows it to punch through it.
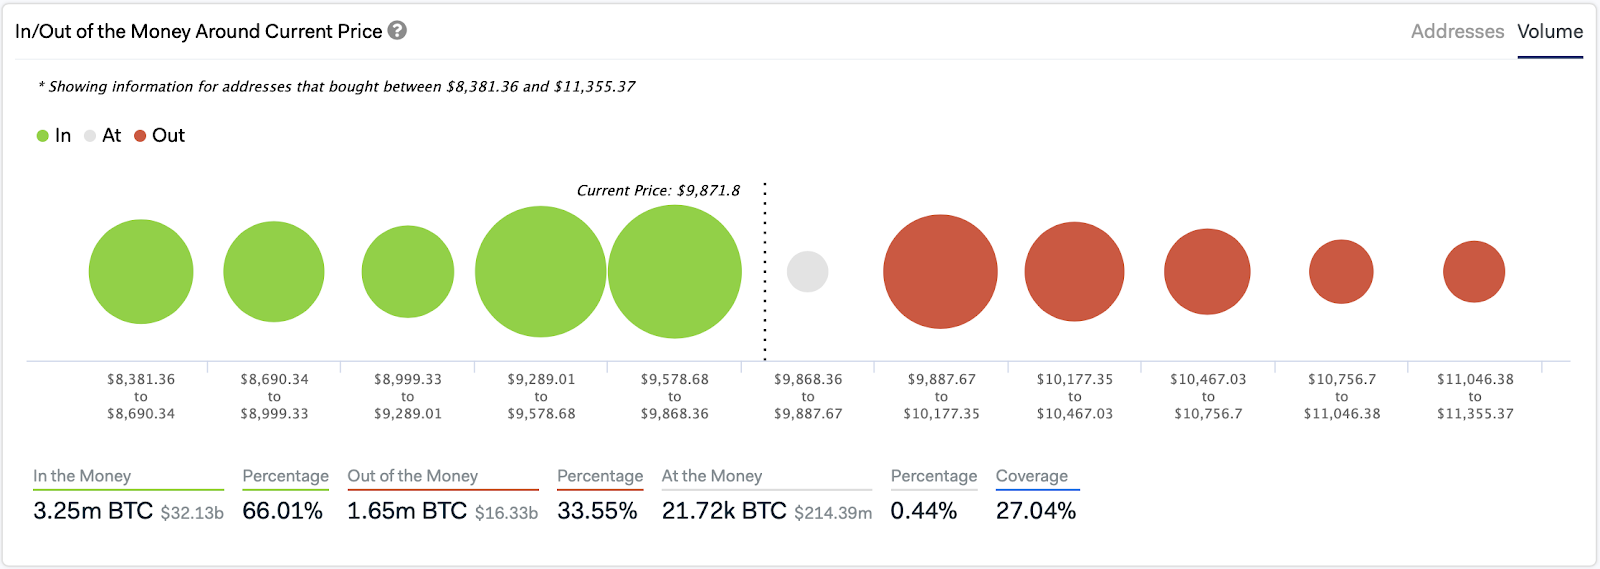
It is worth noting that the bears could also have a hard time sending Bitcoin below $9,300. The IOMAP estimates that 2.3 million addresses bought 1.9 million BTC at an average price of $9,580. These market participants could hold to their investments, preventing the pioneer cryptocurrency from a further correction.
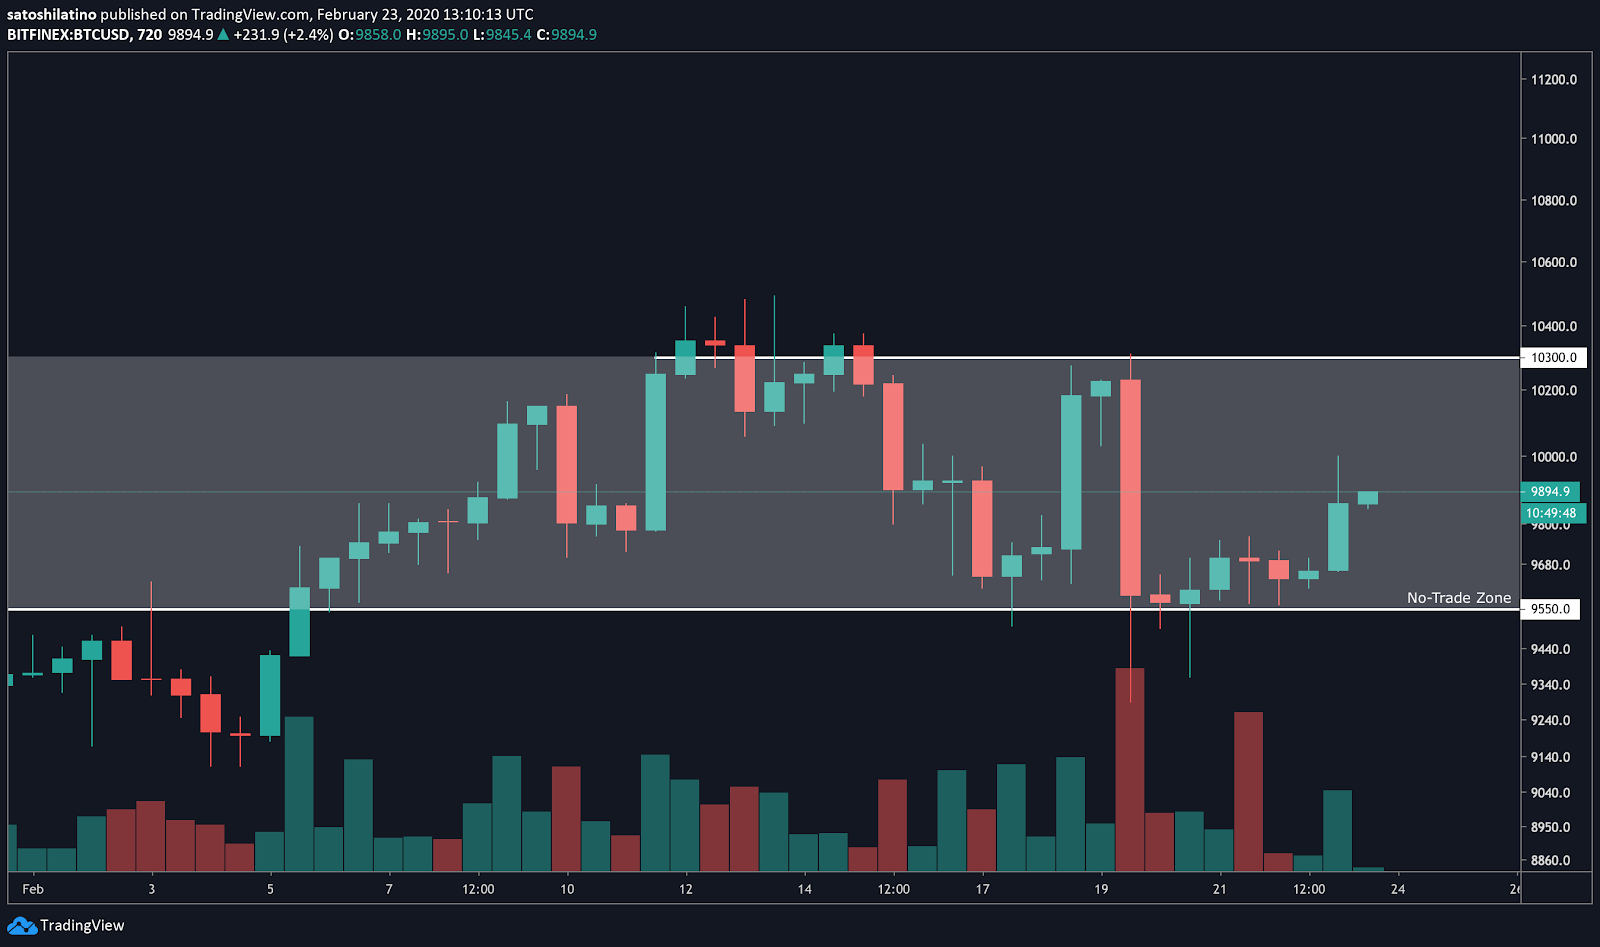
Due to the substantial number of investors that bought Bitcoin between $9,580 and $10,300, this range is a reasonable no-trade zone. Trading within it poses high risk since it cannot be determined, at the moment, whether BTC will breakout in an upward or downward direction.
Based on the Fibonacci retracement indicator, a close above resistance could take Bitcoin to new yearly highs. This technical index estimates that an increase in buy orders upon the break of the $10,300 hurdle could push this cryptocurrency to the 127%, 141%, or 162% Fibonacci retracement levels. These resistance barriers sit at $11,500, $12,150, and $13,000, respectively.
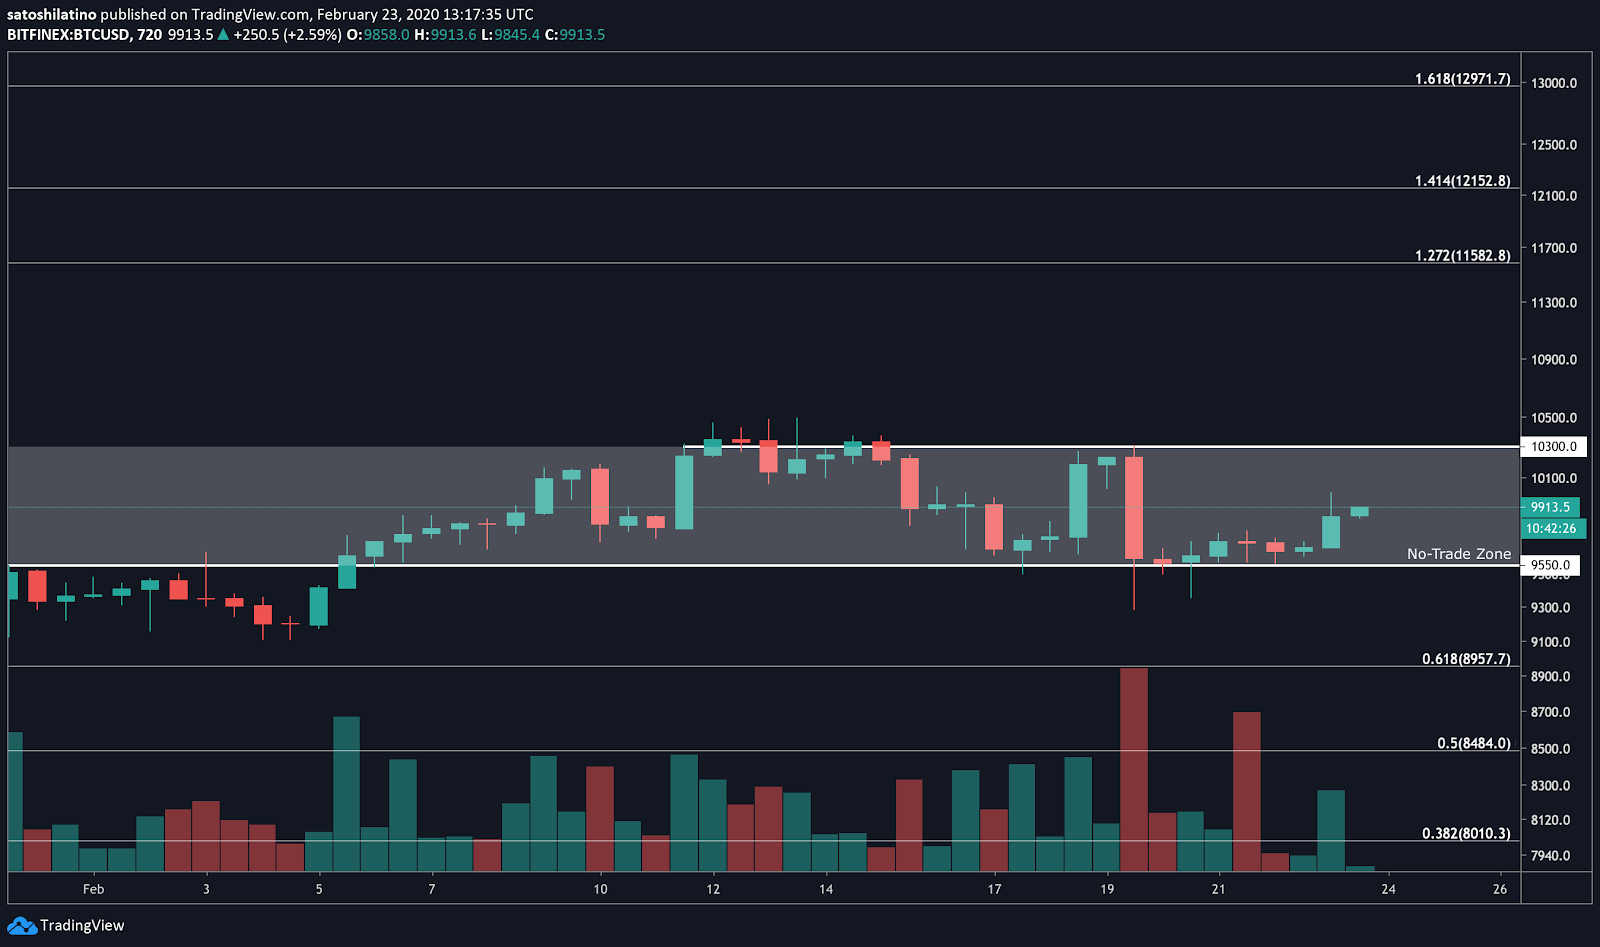
Nonetheless, moving below the $9,580 support cold trigger a sell-off among those 2.3 million addresses that bought Bitcoin around this price level. If this happens, the flagship cryptocurrency would likely see its price plummet to the next support levels presented by the 62%, 50%, and 38% Fibonacci retracement levels. These areas of support are sitting at $9,000, $8,500, and $8,000, respectively.
Moving Forward
Even though Bitcoin is consolidating between $10,300 and $9,580, some of the most prominent figures in the industry maintain that the bull market is just getting started.
Binance’s CEO Changpeng Zhao, for instance, recently published a tweet detailing how BTC behaved before and after its previous halvings. In the charts, the pioneer cryptocurrency can be seen skyrocketing nearly 80x after its first block rewards reduction event and 28x after its second.
History may not predict the future, and correlation does not prove causation.
Here are just 2 charts around the previous #bitcoin halving. Watch what happens AFTER halving. Markets are inefficient, at least, historically.
Just data, draw your own conclusions. pic.twitter.com/AwChmAGvrK
— CZ 🔶 BNB (@cz_binance) February 23, 2020
As the number of people searching for the term “bitcoin halving” rises, Arcane Research believes that this could be a positive sign. The firm says the Bitcoin halving will spark interest among investors, sending BTC to revisit $20,000.
But, bears are notoriously underrepresented among traders. Regardless of the optimistic views, investors should wait for confirmation of a break above resistance before entering any bullish trades.