
Shutterstock cover by Mariia Kozyr
Bitcoin Struggling Against Bearish Momentum
Bitcoin is having a hard time recovering amid a more general market downturn.
Bitcoin is struggling to find a stable support floor as bears appear to have taken over. Historical price action suggests that BTC must hold above $37,300 to avoid capitulation.
Bitcoin Bulls Put to Test
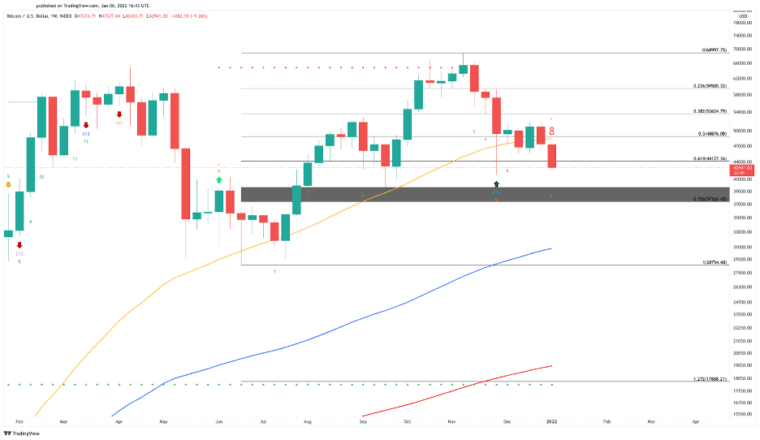
Bitcoin has breached the $45,000 support level, and is threatening to dip lower. At press time, Bitcoin was trading just under $43,500.
The Fibonacci retracement indicator, measured from Jun. 2021’s low at $28,750 to the all-time high at $69,000, suggests that Bitcoin will continue its descent. The next critical demand barrier underneath the flagship cryptocurrency lies between $39,000 and $37,300.
Such a crucial interest zone might have the strength to hold since the Tom DeMark (TD) Sequential prepares to present a buy signal on the weekly chart. The bullish formation forecasts that around Jan. 17, Bitcoin could enter a one-to-four week run-up or a new upward countdown.
The buying pressure that might be generated in the next two weeks is critical for Bitcoin to regain the 50-day moving average at $50,000 as support and march towards record highs.
Failing to gain enough steam can be devastating for the bulls as the 100- and 200-day moving averages are the last demand zones underneath BTC. These key levels sit at $30,000 and $19,000, respectively.
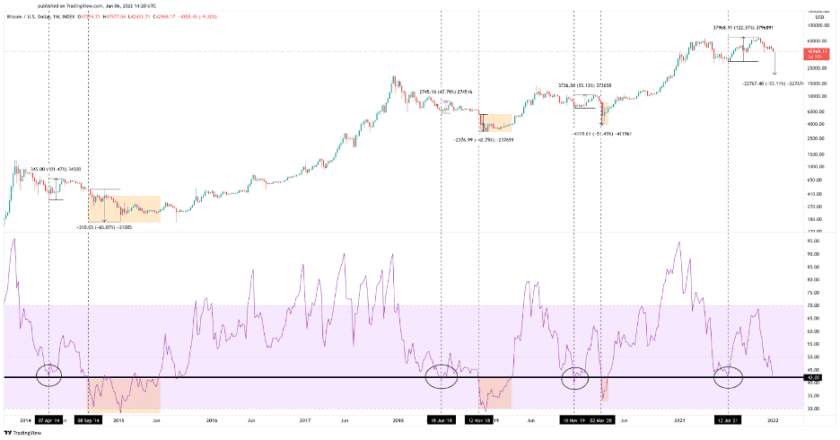
Although a capitulation event may appear out of the question given the strong fundamentals behind Bitcoin, the Relative Strength Index suggests otherwise.
The RSI appears to have behaved a certain way each time Bitcoin is capitulated since the 2014 bear market. This momentum indicator tends to drop to the 42 level, rebound, and then breach this support floor to mark the beginning of a sell-off.
Similar market behavior occurred over the past six months. In Jul. 2021, the RSI bounced off the 42 level to reach 69 in Nov. 2021. The rejection pushed the RSI back to 42, where it currently holds. If history were to repeat itself, it is reasonable to assume that capitulation towards $19,000 is near.
While Bitcoin appears to head lower, the bulls must prepare to defend the $39,000-$37,300 support wall at all costs. Such a crucial demand zone can represent one of BTC’s last opportunities to resume its uptrend for some time.
Disclosure: At the time of writing, the author of this piece owned BTC and ETH.