 Earn with Nexo

Bulls Take Control of Litecoin Price Action
While some indicators suggest the trend is facing exhaustion.
Litecoin hit an important milestone in its trend that could catalyze a new rally. However, contrary to the milestone, a technical pattern is signaling exhaustion.
Demand for LTC is on the Rise
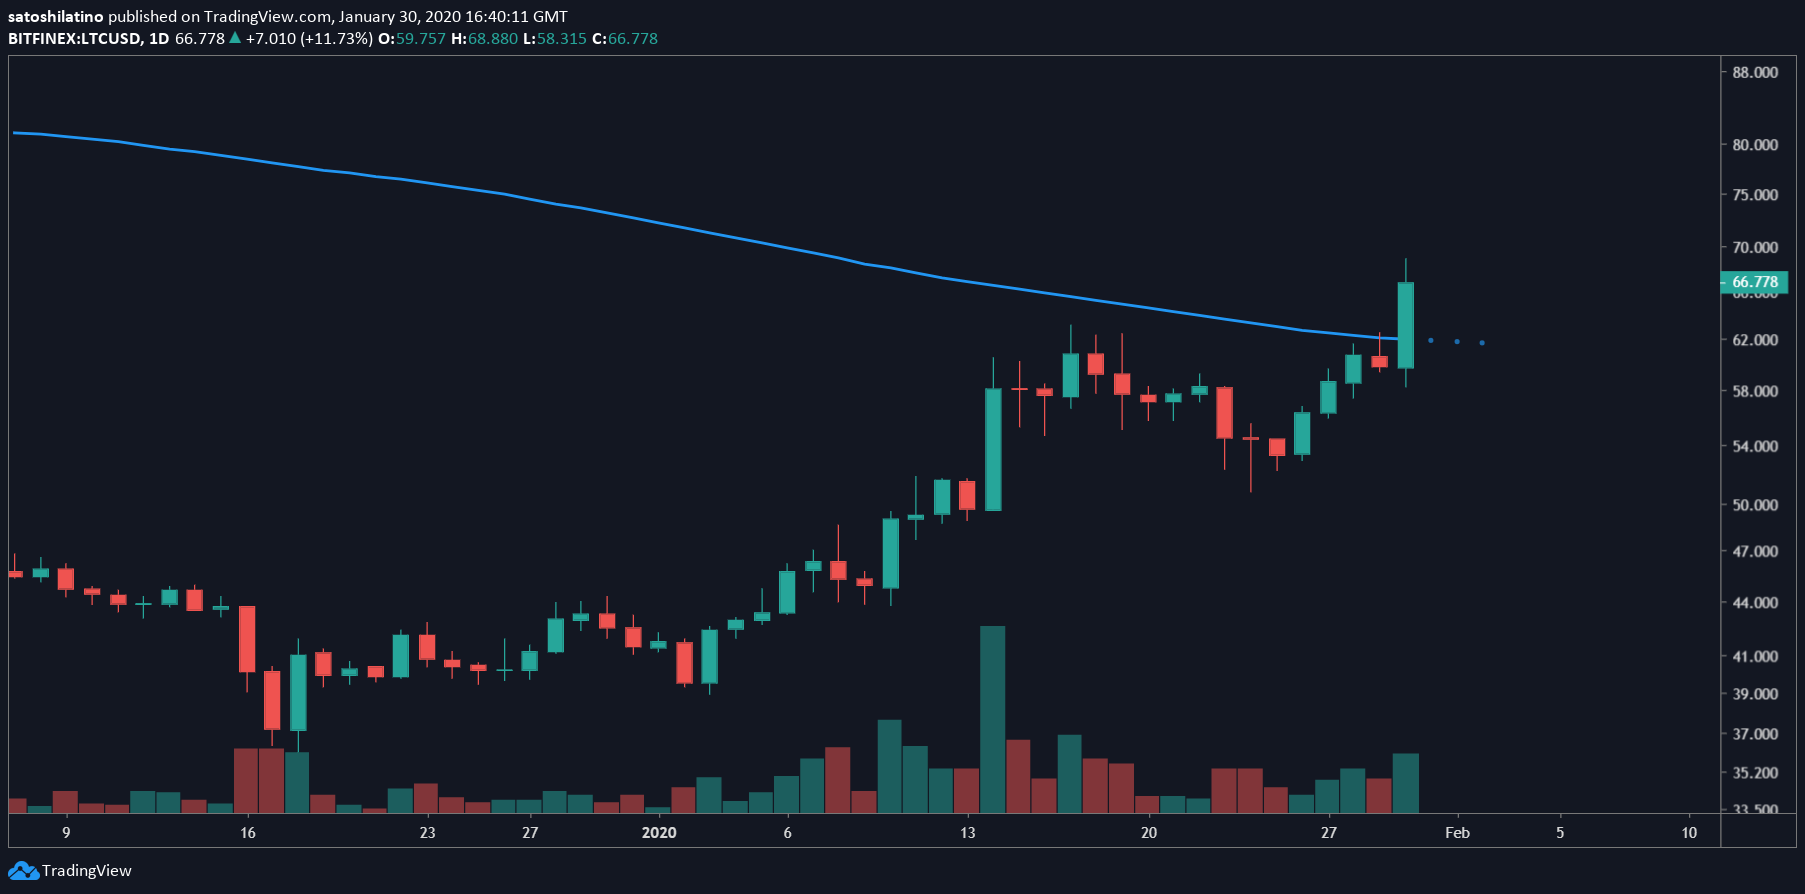
In the last 24 hours, Litecoin experienced a bullish impulse that saw its price surge by 18%. LTC went from trading at a low of $58.30 to a high of $68.90. The sudden upswing allowed LTC to move above its 200-day moving average.
Turning this significant level of resistance into support is usually considered by many technical analysts as a sign that a major bull rally is on the horizon. As a matter of fact, the last time Litecoin was able to cross above its 200-day MA was on Feb. 8 of last year. Following this milestone, LTC surged over 300% to peak at a high of $147 on June 22, 2019.
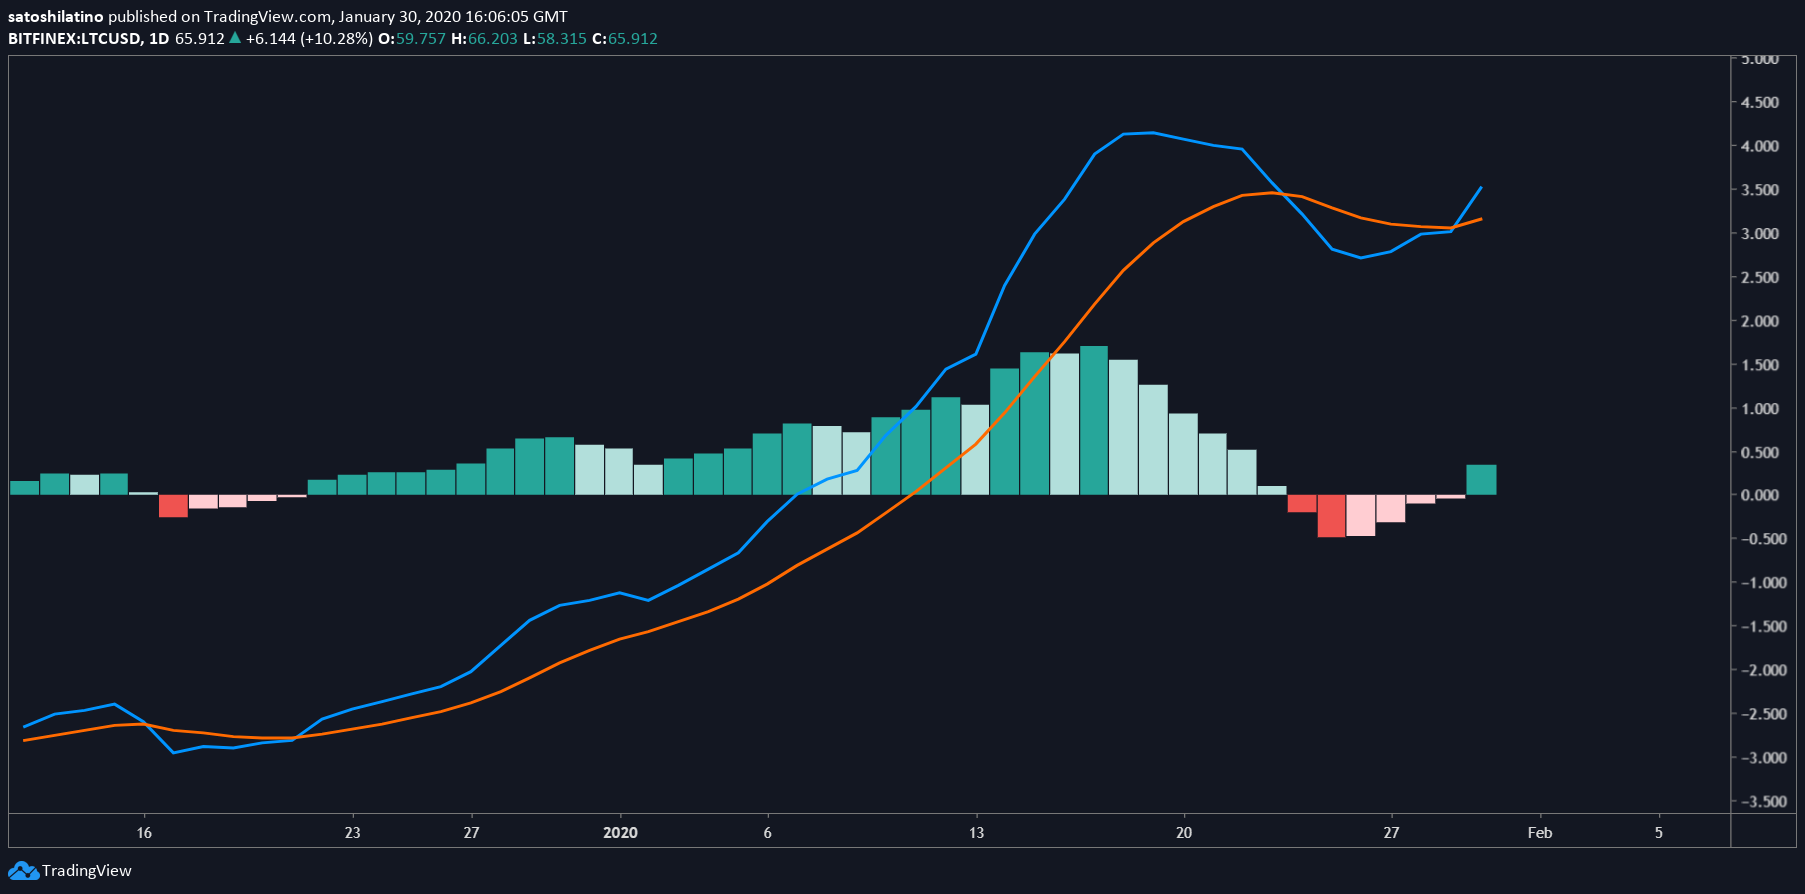
The moving average convergence divergence, or MACD, also turned bullish recently adding credence to a further advance. This technical indicator follows the path of a trend and calculates its momentum.
As the 12-day EMA crossed above the 26-day EMA, the odds for a further upward push increased.
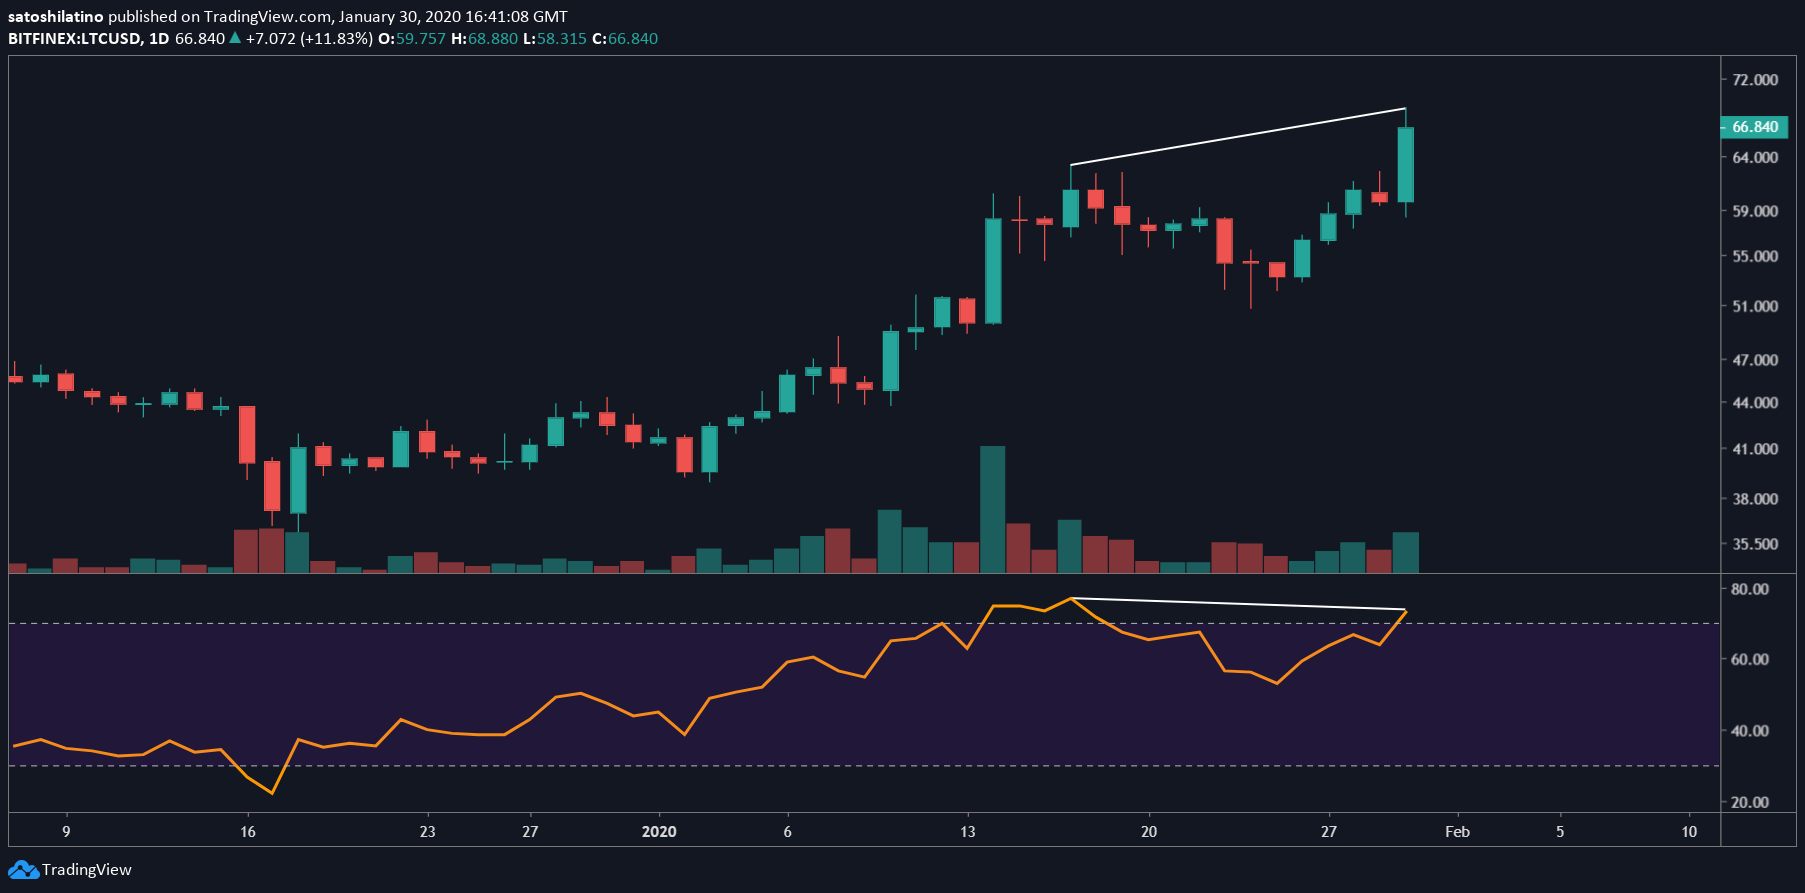
Despite the bullish outlook, a bearish divergence between the price of Litecoin and the Relative Strength Index (RSI) is forming on LTC’s 1-day chart.
Divergences occur when the price of an asset is making a series of higher highs while the RSI is making lower lows. Although this technical pattern does not provide a precise selling point, it is a sign that the uptrend is reaching an exhaustion point.
Based on the Fibonacci retracement indicator, if demand for LTC continues to increase the next levels of resistance it will face are $70.54 and $74.40. This is where the 127.2% and 141.4% Fibonacci retracement levels sit, respectively.
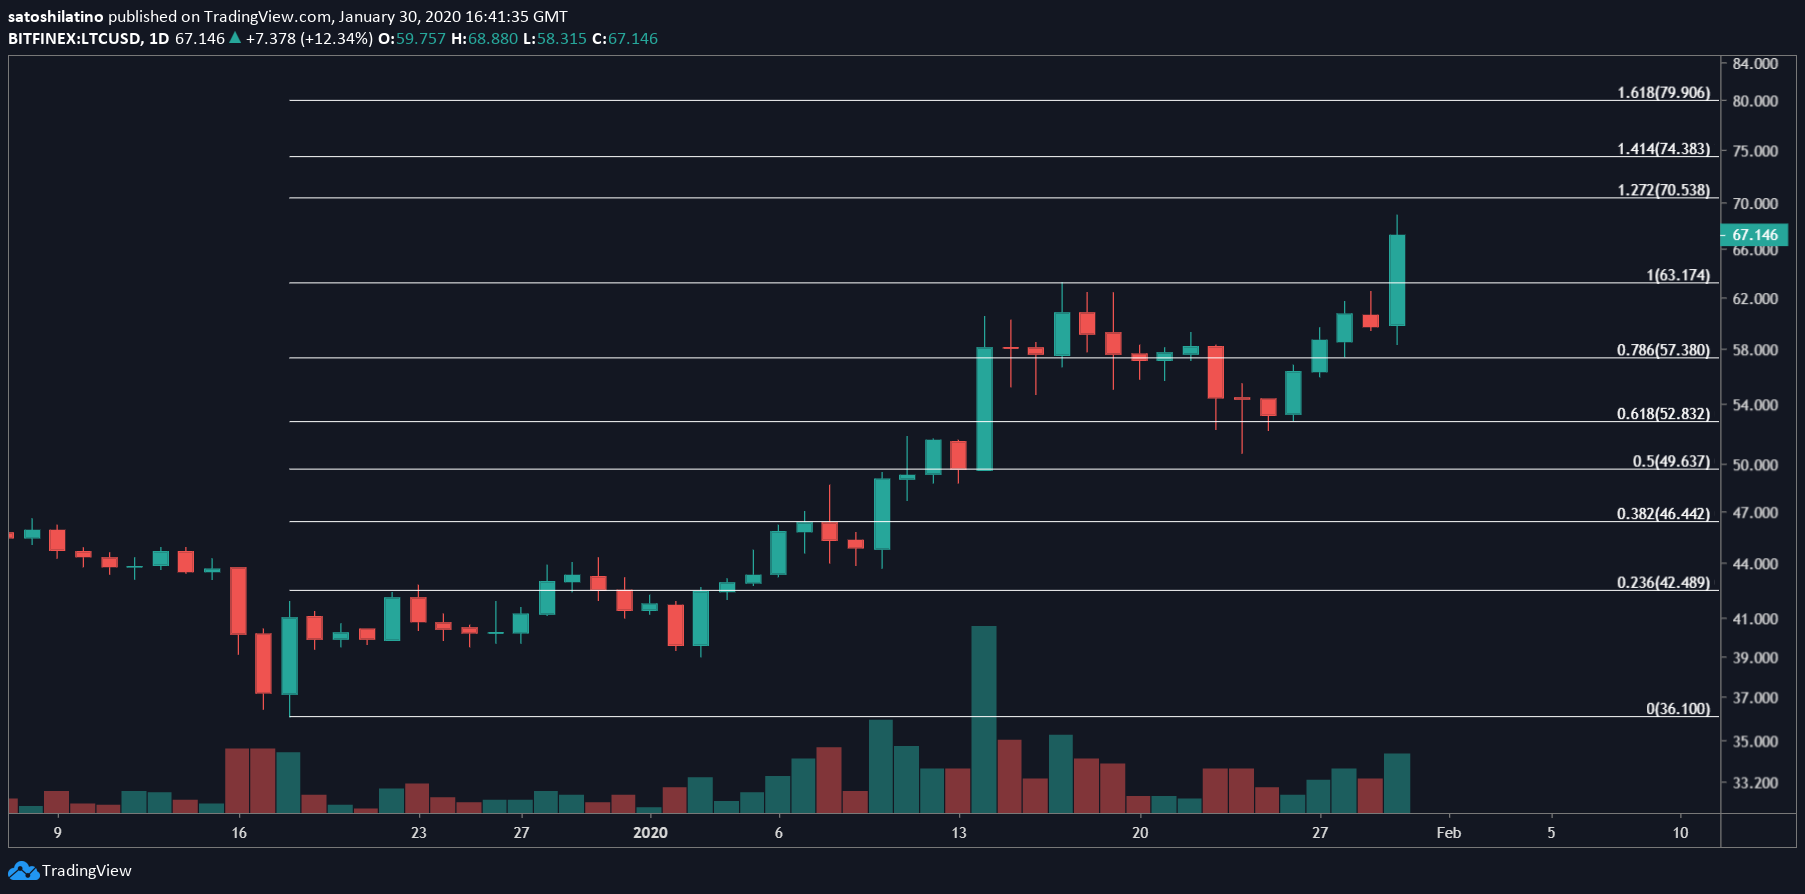
Conversely, a spike in the selling pressure behind this cryptocurrency could validate the bearish outlook presented by the RSI divergence. If Litecoin is indeed bound for a pullback before the continuation of the bullish trend, it could try to test the $63.17 support level. Breaking below this price hurdle would likely push its price further down to the next levels of support around $57.40 and $52.80.
It is worth noting that corrections are part of bull markets. In fact, they help maintain a healthy uptrend by presenting an opportunity for sideliners to get back into the market. A fresh inflow of capital is usually followed by a further advance.