Chainlink, AAVE May Dip Again Before Uptrends Resume
Chainlink and AAVE appear to have another leg down until they reach stable support.

Key Takeaways
- Chainlink has seen its price drop by more than 28% since Nov. 10.
- AAVE has also dipped by over 24% within the same period.
- These cryptocurrencies could dive further before encountering stable support.
Share this article
Chainlink and AAVE have dropped by more than 24% in the last seven days as the cryptocurrency market has gone through a period of increased profit-taking. Technical patterns indicate further losses on the horizon before the uptrend resumes.
Chainlink Approaches Rebound Zone
Chainlink has seen its market value drop by more than 28% over the past week, with one support level preventing further losses.
The Tom DeMark (TD) Sequential indicator presented a sell signal on LINK’s 3-day chart on Nov. 12. The bearish formation developed as a green nine candlestick, anticipating a one to four 3-day candlesticks correction.
The pessimistic outlook appears to have been validated as LINK dropped to the 100-three-day moving average at $29. If this crucial support level continues to hold, prices could rebound towards $70.
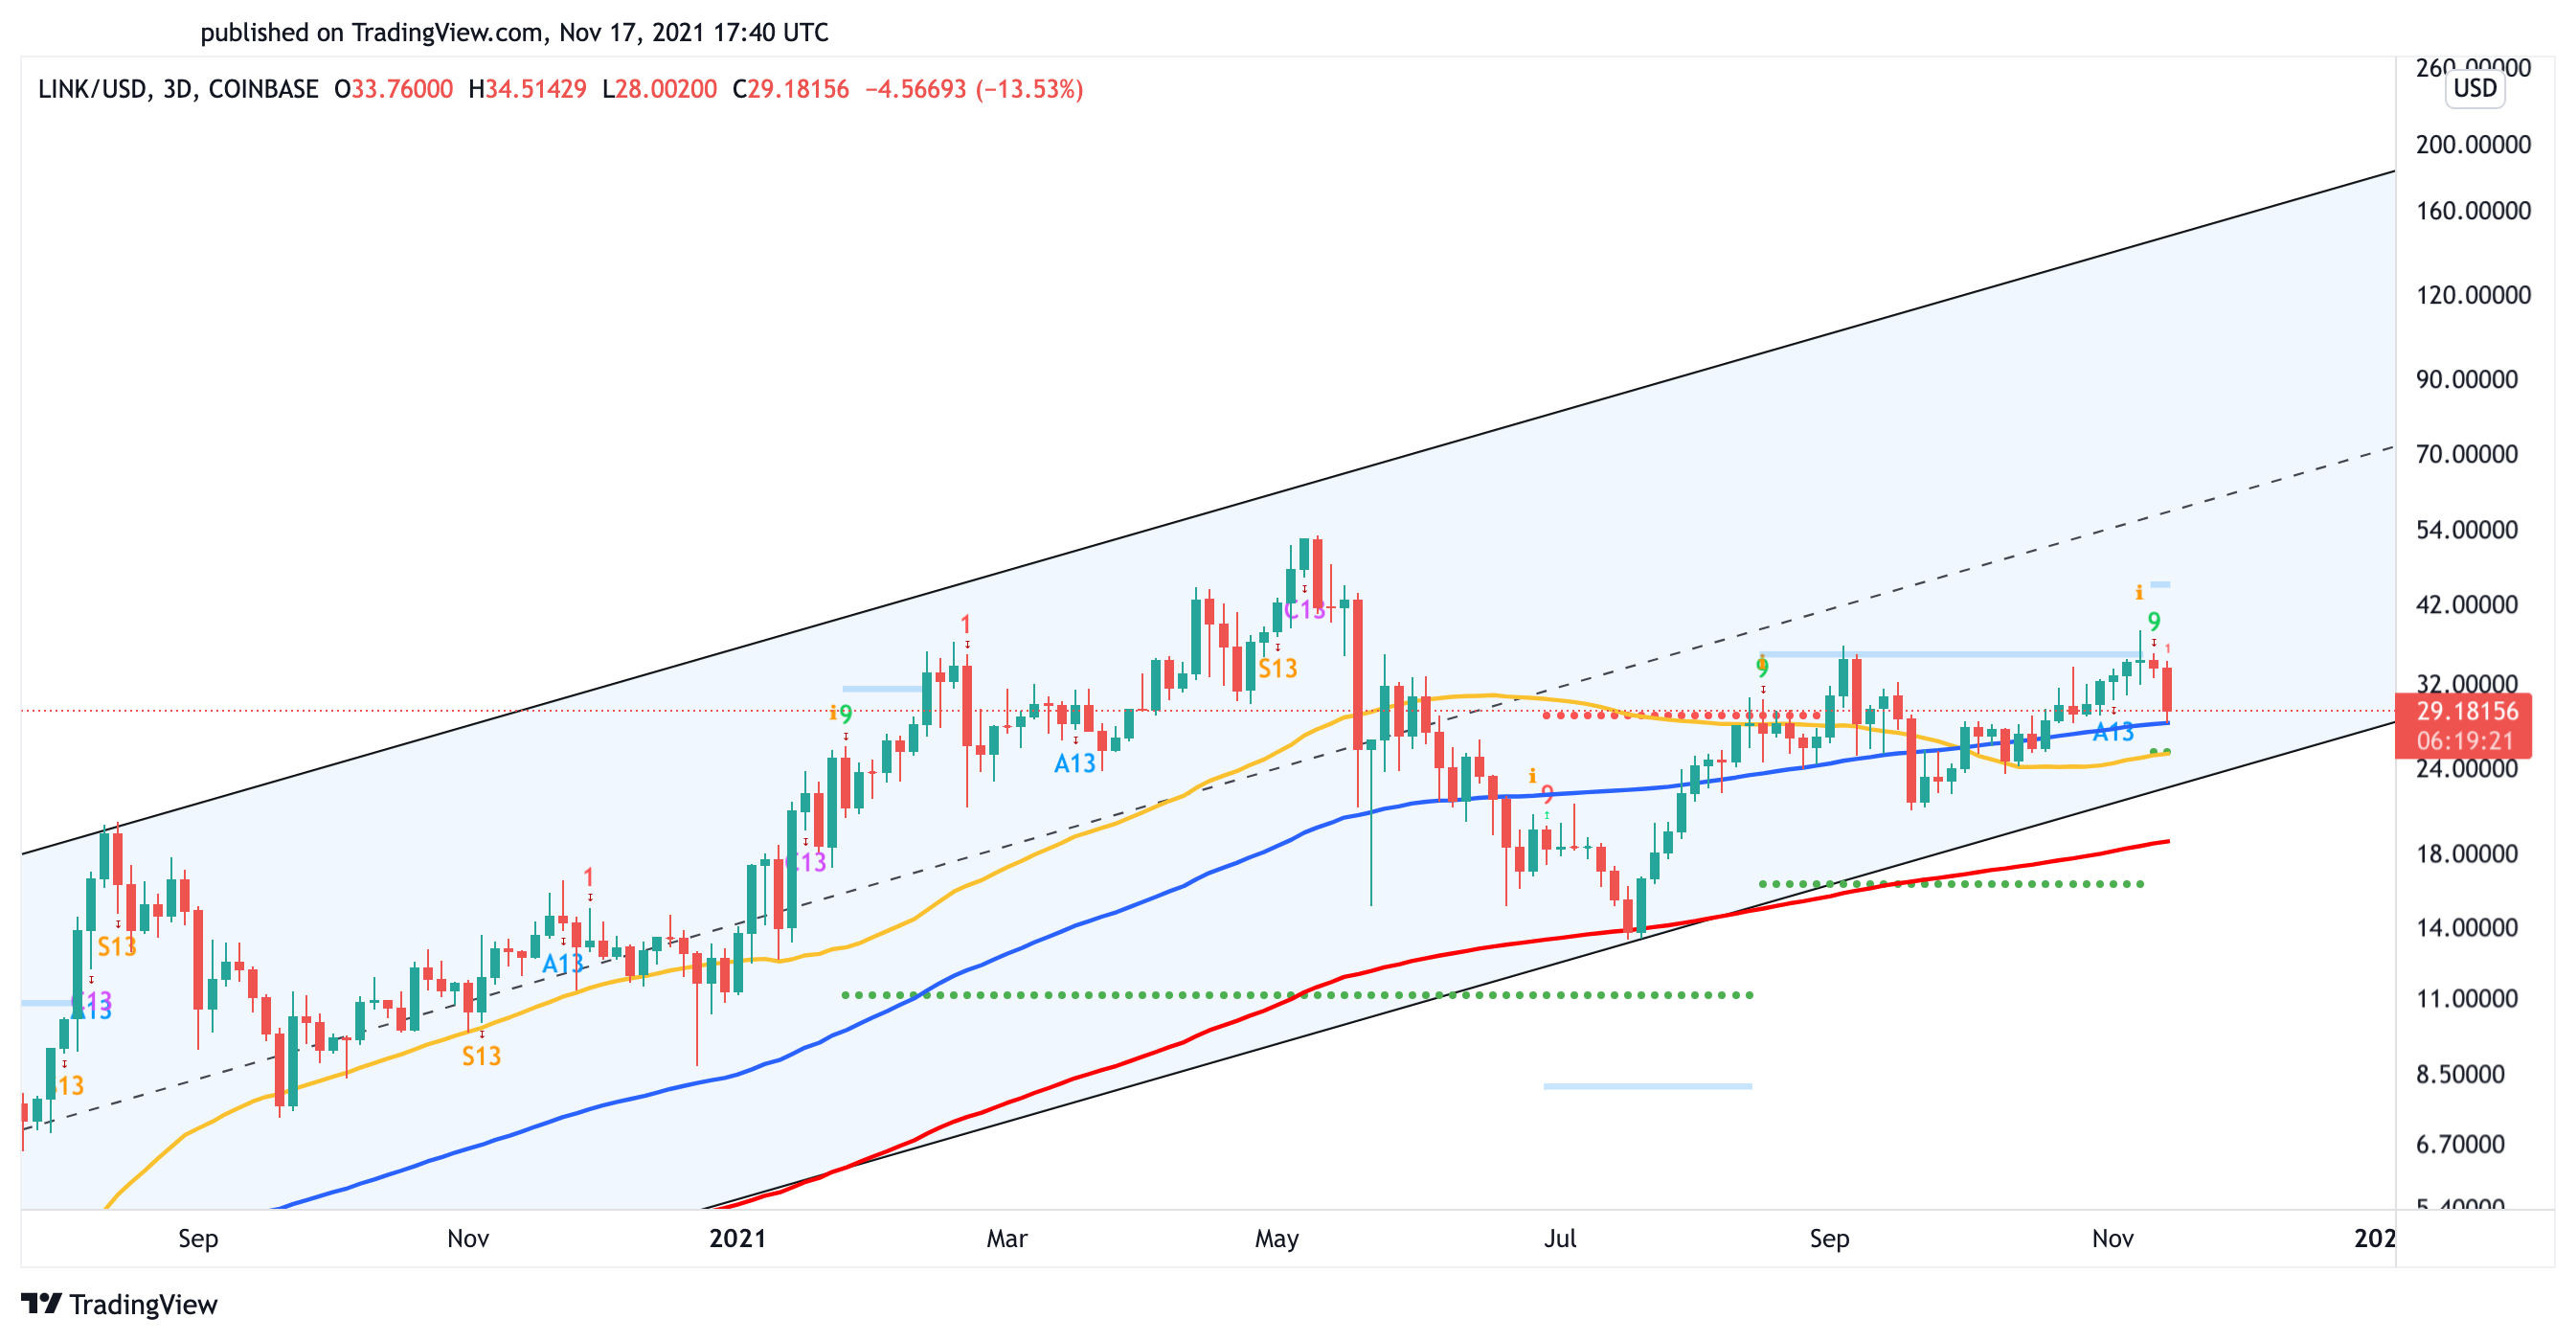
However, losing the 100-three-day moving average as support could see Chainlink test the 50-three-day moving average at $25 and offer a better opportunity for sidelined investors to get back into the market. Chainlink’s price history suggests that $25 could be the point of max pain as it coincides with the lower edge of a parallel channel where this altcoin has been contained since May 2018.
Every time LINK has dropped to this technical formation’s lower boundary since then, the downtrend has reached exhaustion, and prices have rebounded to the pattern’s upper edge. From this point, LINK tends to get rejected, which is consistent with the characteristics of a parallel channel.
Now that Chainlink appears to be approaching the channel’s lower trendline, it looks like a bullish impulse could be underway. Similar price action to the past three years can see LINK rise toward the channel’s middle or upper trendline after hitting $25.
These resistance areas sit at $70 and $200, respectively.
AAVE Edges Closer to High Volatility
AAVE appears to be getting ready to make a major price move.
The 50th-largest cryptocurrency by market cap has endured a ten-month-long stagnation period, making a series of lower highs and higher lows. Such price behavior has led to the formation of a symmetrical triangle on its 3-day chart.
The 24% correction AAVE has gone through over the past week resulted from a rejection by the triangle’s descending trendline. The retracement could extend until prices hit the pattern’s ascending trendline at $245.
As the DeFi token edges closer towards the triangle’s apex, it signals that more significant spike volatility is imminent.
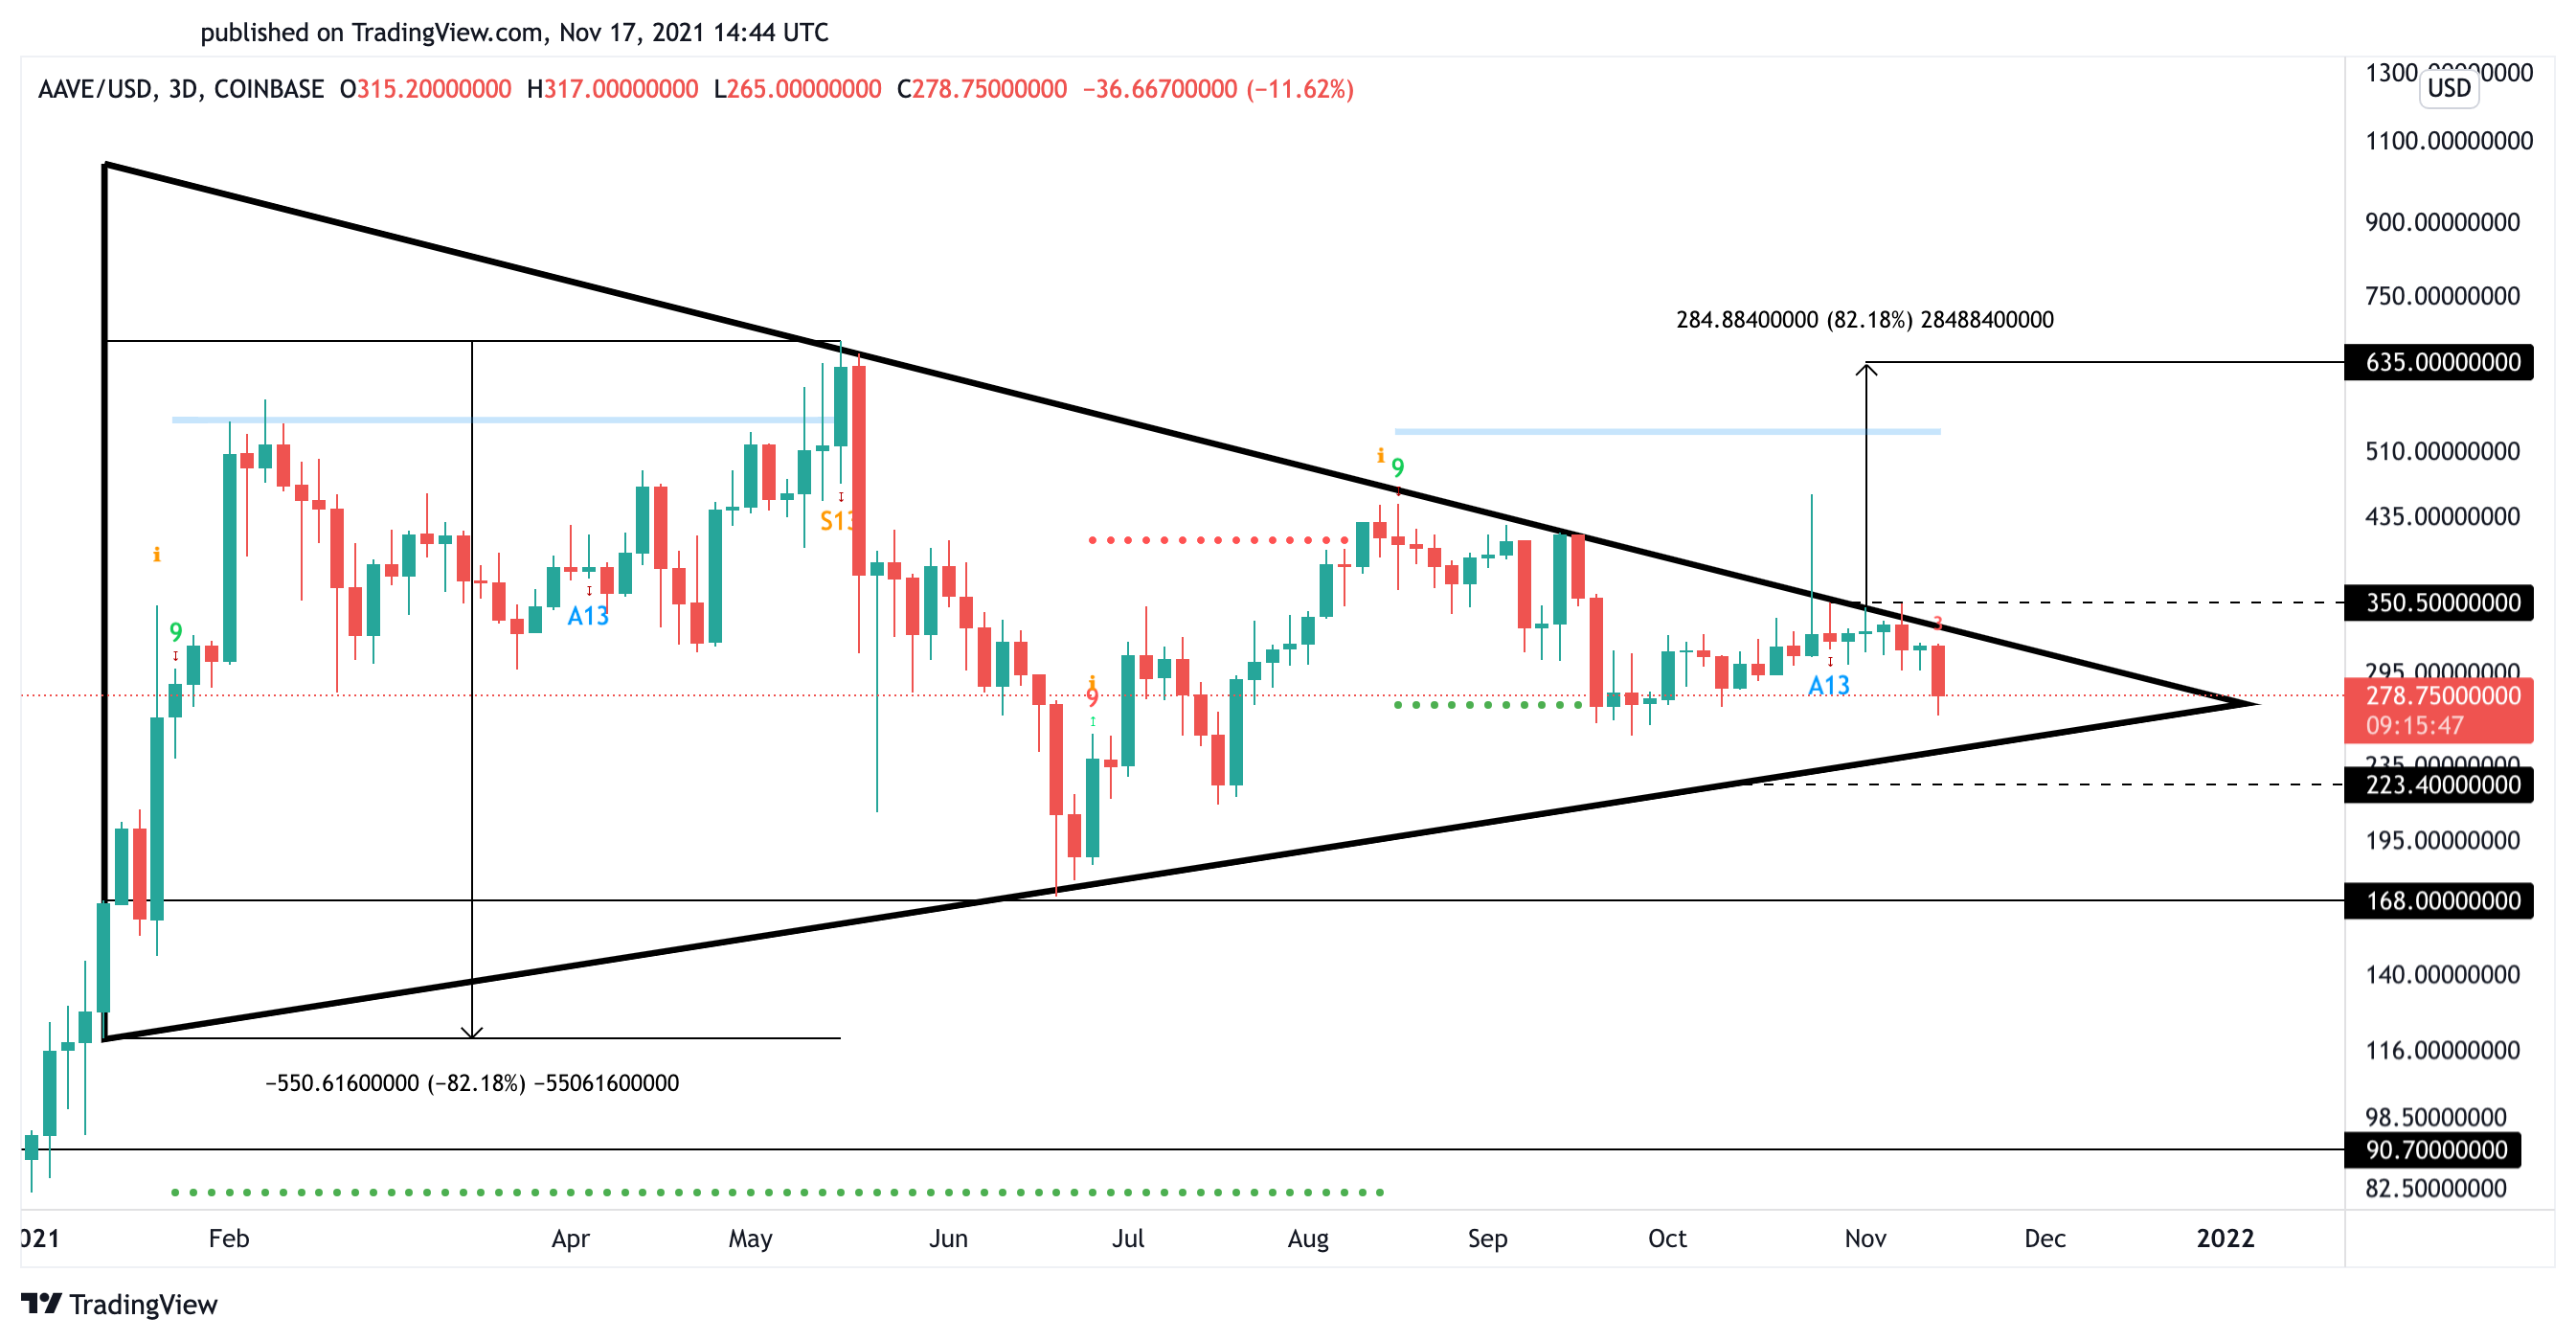
Breaking through the $350 resistance level could see AAVE rise by more than 82% towards $635. Still, investors must keep the triangle’s rising trendline at $245 as support for the optimistic outlook to be validated. Failing to do so could result in a steeper correction towards $168 or even $91.
Disclosure: At the time of writing, the author of this feature owned BTC and ETH.
Share this article
