
Chainlink Bounces Off Crucial Support, LINK Aims for $12
Chainlink is on its way to recovery, facing little to no resistance ahead.
LINK went through a 64% correction after rising to an all-time high of over $20 in mid-August. Despite the losses, the so-called “Chainlink marines” have been reluctant to sell.
And now, multiple technical indexes suggest that they may be rewarded for their strong hands.
Chainlink Prepares to Resume Uptrend
When looking at Chainlink’s price action on its 12-hour chart, the decentralized oracles token appears to be contained within an ascending parallel channel over the past two months.
Each time LINK has risen towards this technical formation’s upper boundary, it gets rejected and retraces to the lower edge. And from this point, it tends to rebound, consistent with a channel’s characteristics.
After the most recent retest of the underlying support, it seems like many buy orders were filled. The spike in buying pressure around this price level helped Chainlink rebound over 10% in the last few hours.
Now, the token is on its way up to the ascending parallel channel’s middle or upper line. These critical areas of interest sit at $12 and $14.5, respectively.
The parabolic stop and reverse metric, or “SAR,” adds credence to the optimistic outlook.
This trend-following indicator forecasts that Chainlink’s downtrend has reached exhaustion. As the stop and reversal points moved underneath LINK’s price, the odds for a further advance increased drastically.
Historically, the stop and reversal system has been highly effective in determining the course of this altcoin’s trend. The last two times the parabolic SAR flipped from bearish to bullish within the 12-hour chart, LINK’s price surged by 32% and 34.5%, respectively.
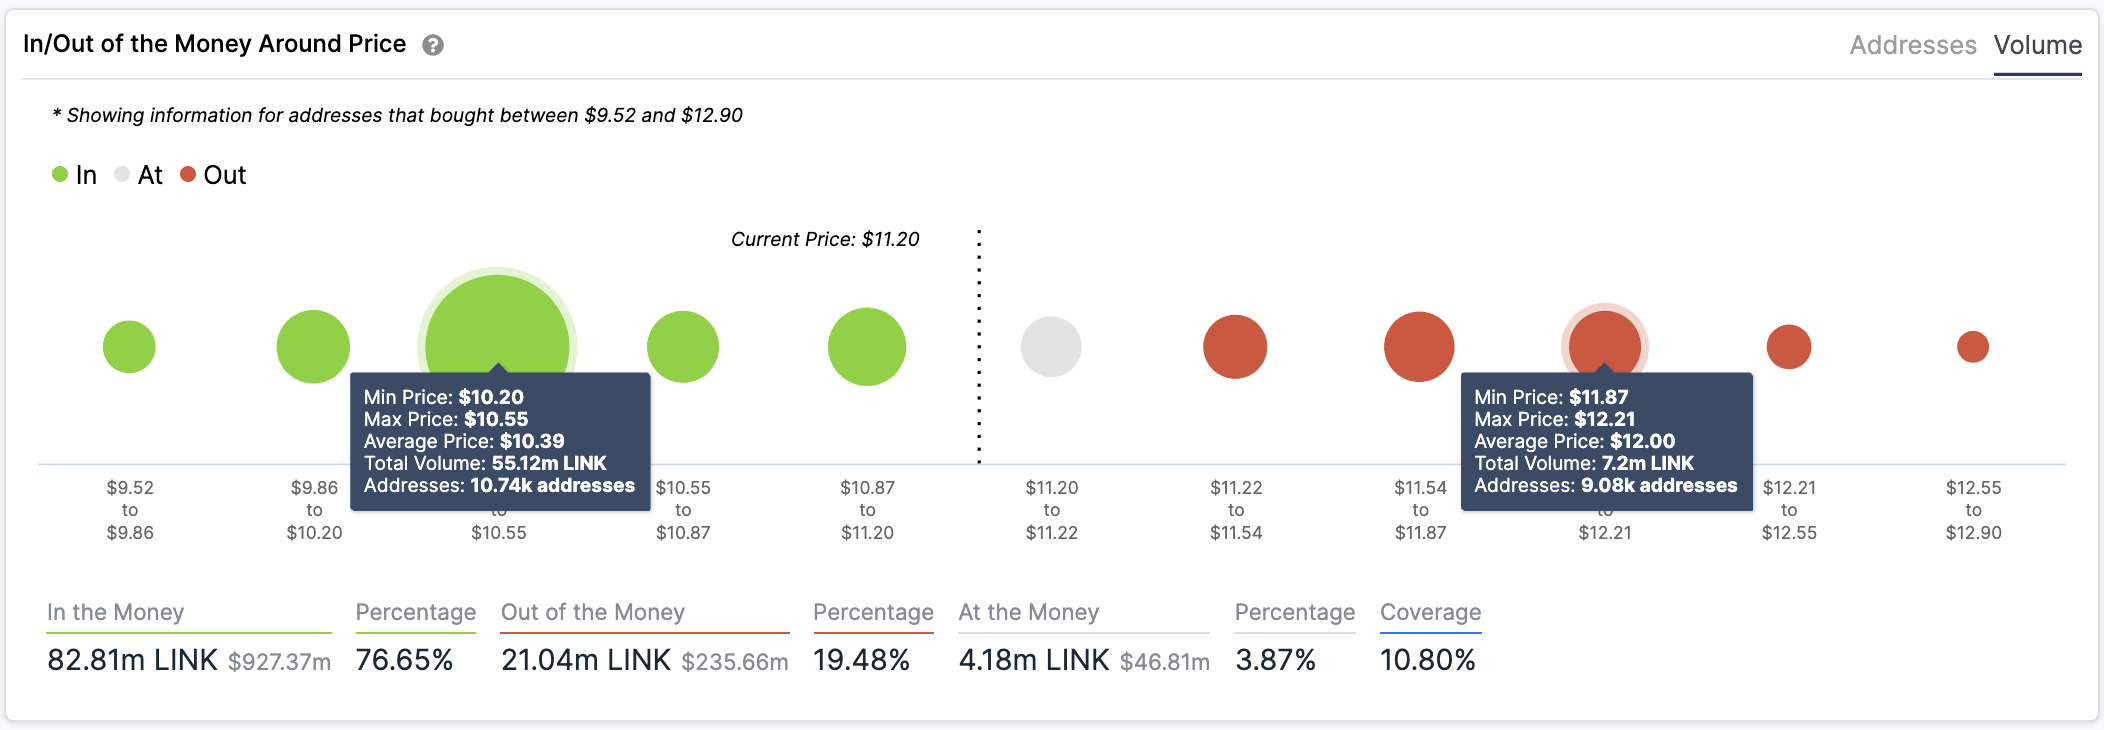
IntoTheBlock’s “In/Out of the Money Around Price” (IOMAP) model reveals if all the bullish signals are validated, Chainlink will likely face stiff resistance around the middle line of the parallel channel previously mentioned.
Based on this on-chain metric, approximately 9,000 addresses had previously purchased over 7 million LINK between $11.9 and $12.2.
Such a critical supply barrier may contain rising prices at bay as holders within this range will likely exit their underwater positions. Slicing through this hurdle, however, could see prices climb towards the channel’s upper boundary at $14.5.
Regardless of the bullish outlook, the crypto market’s unpredictability makes it impossible to disregard the other side of the picture.
If sell orders were to pile up, triggering a sudden downswing, the range between $10.2 and $10.6 could hold.
Nearly 11,000 addresses bought over 55 million LINK around this price level.