
Chainlink Will Suffer Deep Decline Says Analyst
Chainlink saw its price double in less than four months. Now, one prominent analyst and several trading indicators show that LINK is ready for a retracement.
Chainlink saw its price double since December. Nevertheless, LINK is preparing for a steep correction, according to one prominent chartist. Different indicators support the prediction.
Chainlink Presents Multiple Bearish Signals
TraderX0X0, a technical analyst in the cryptocurrency community, recently said that Chainlink is about to “go scuba diving.” The trader maintains that the $4.6 level represented a “huge” area of support, but now that LINK has broken below it, there could be a significant retracement.
Although Chainlink pulled back over 12% after peaking at nearly $5 on Mar. 4, TraderX0X0 pointed out that market participants are in the “denial” stage. This stage of the psychological market cycle leads the analyst to believe that this cryptocurrency is aiming for lower lows.
A spike in the selling pressure behind LINK could trigger a sell-off among investors pushing its price down to $4 or lower, said the analyst.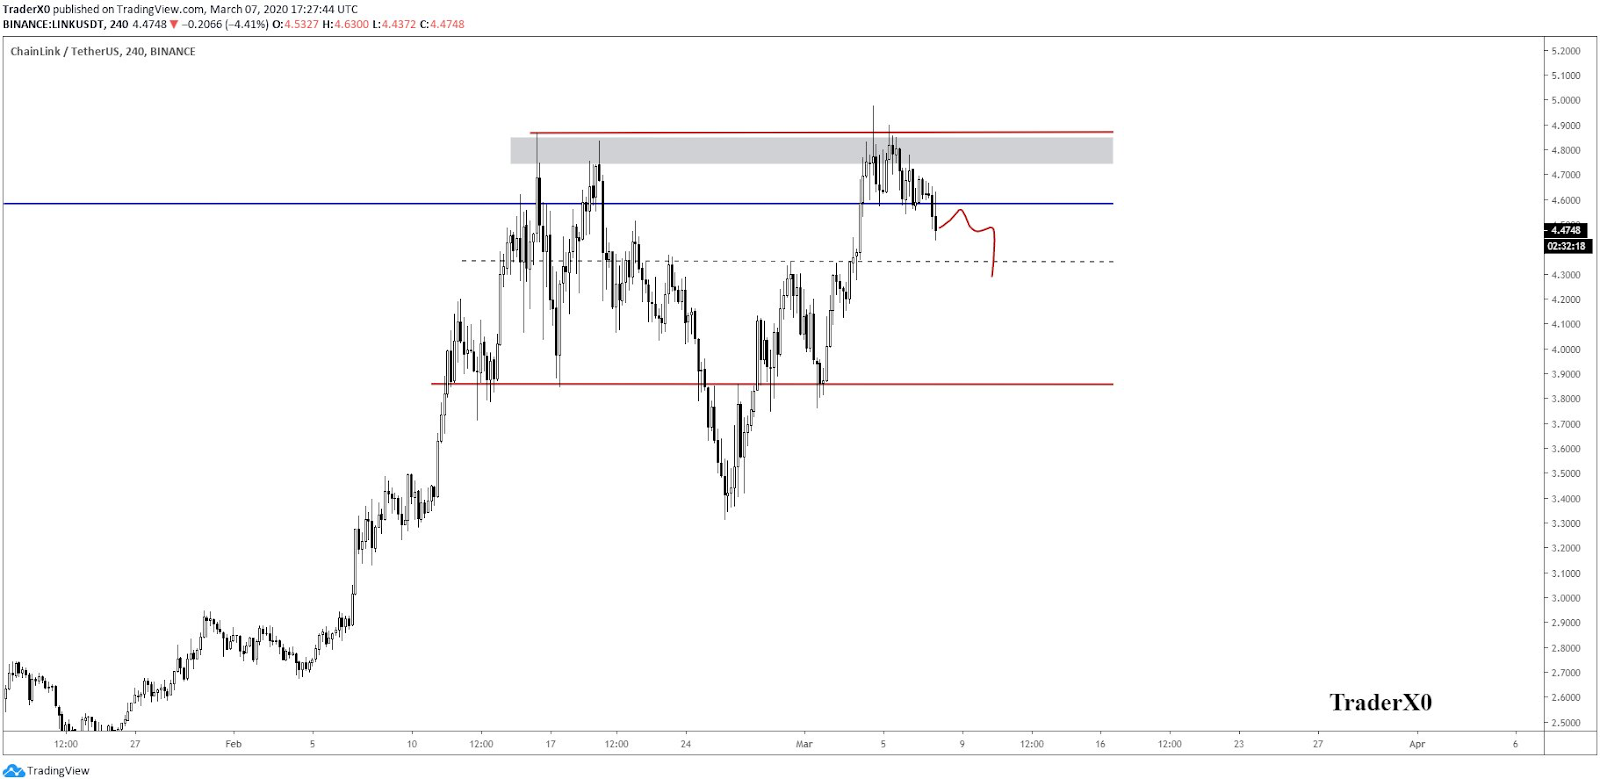
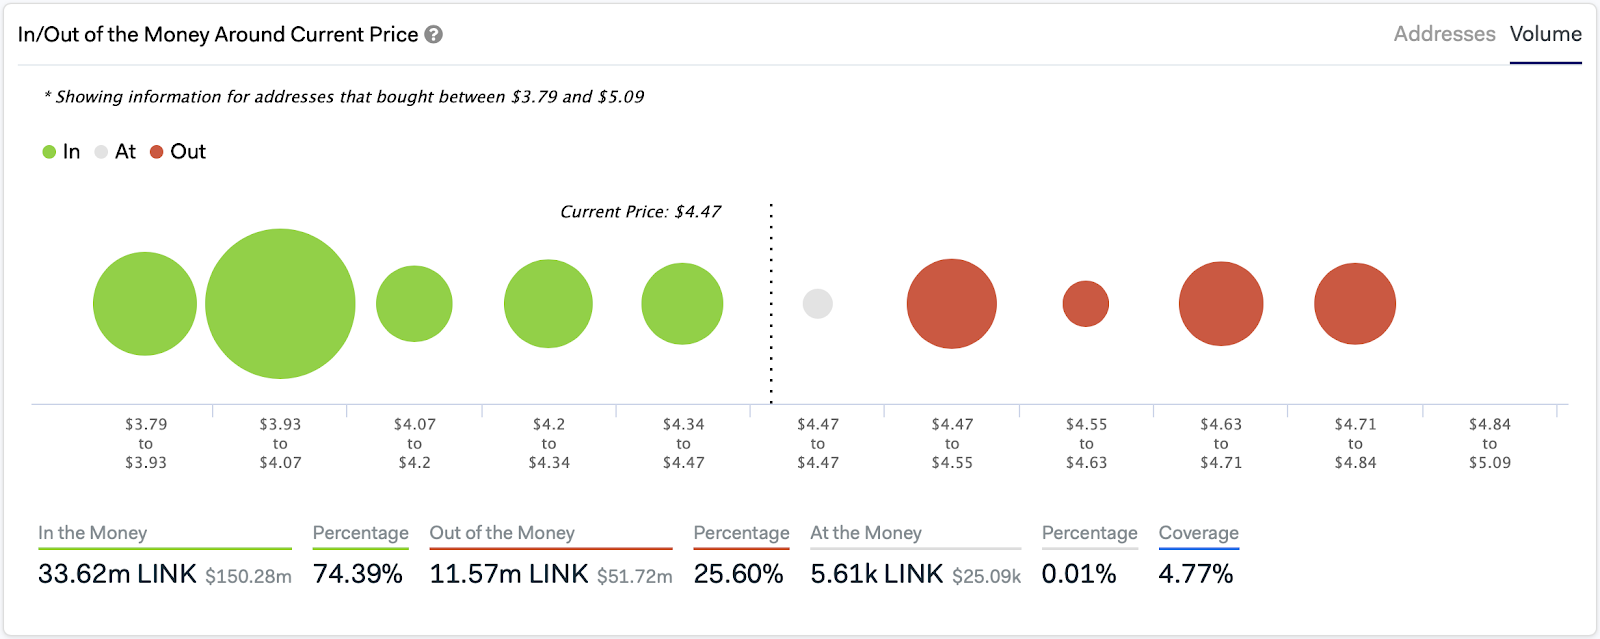
LINK/USD on TradingViewBased on IntoTheBlock’s In-Out of the Money Around Current Price model, such downward movement will happen unimpeded since there is not a significant supply barrier between the current price levels and $4. In fact, the IOMAP reveals that the $4 support level would prevent LINK from a further correction. There over 2,600 addresses collectively holding nearly 17 million LINK around this area.
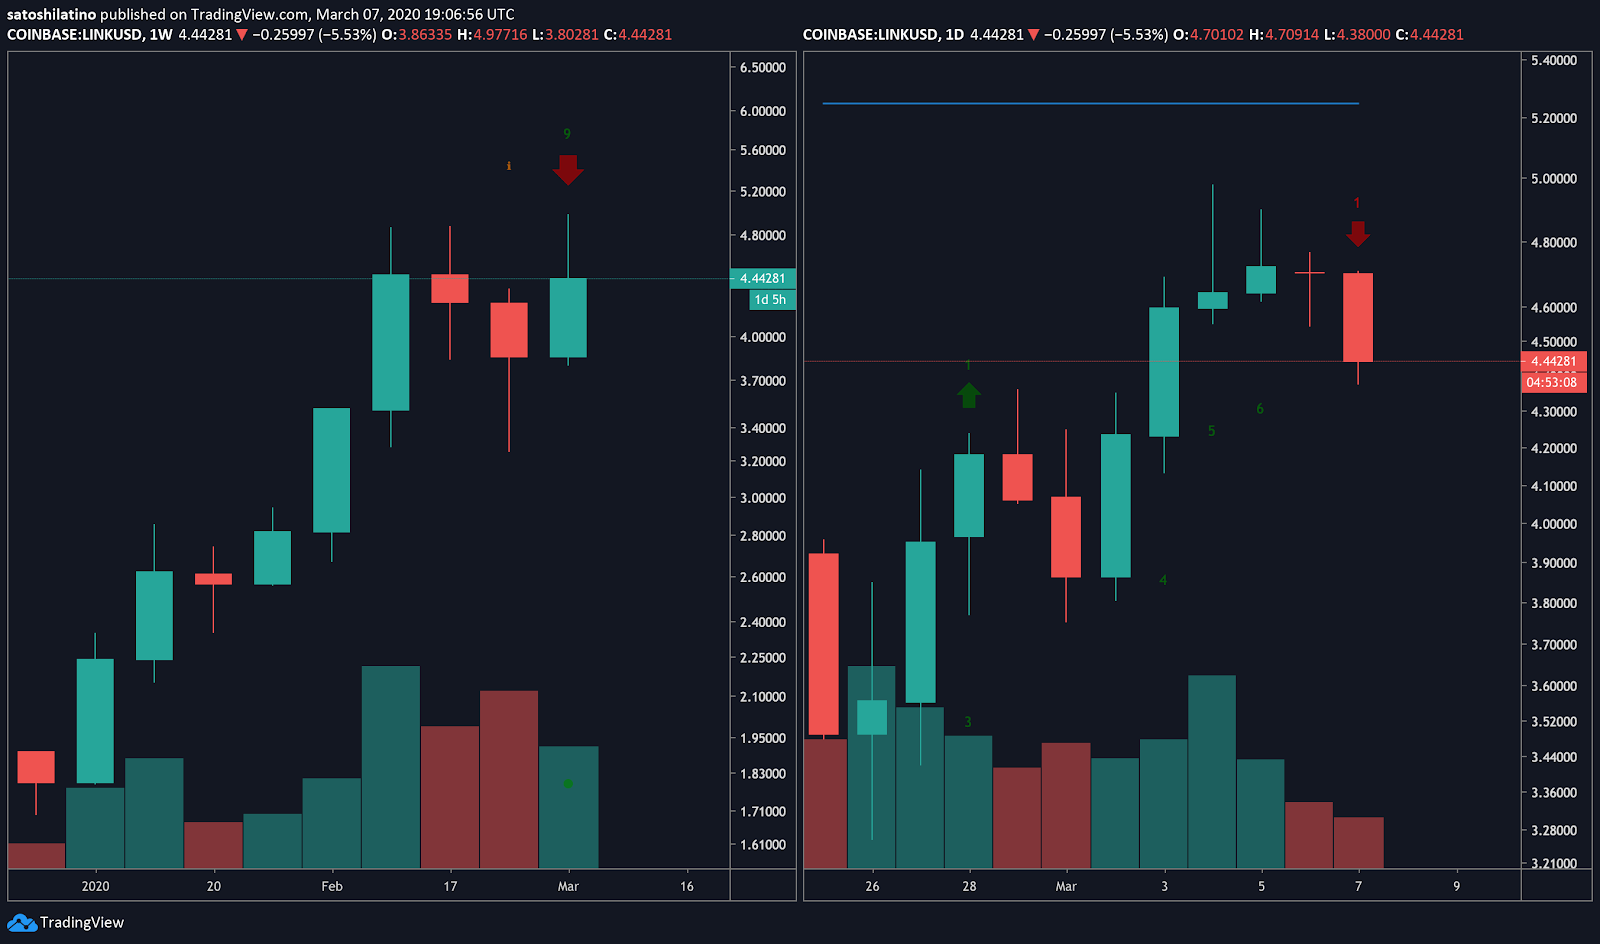
Nevertheless, the TD sequential indicator estimates that this support level may not hold. This technical index presented a sell signal on both the 1-week and 1-day chart. The bearish formation developed in the form of a green nine candlestick, but it transitioned into a red one candlestick on the daily chart due to the downward pressure.
The TD sequential indicator projects that Chainlink could suffer a one to four candlestick correction before it continues its bullish trend. From a macro-perspective such as the weekly chart, it implies that LINK could plummet for one to four weeks, making the chartist’s target conservative.
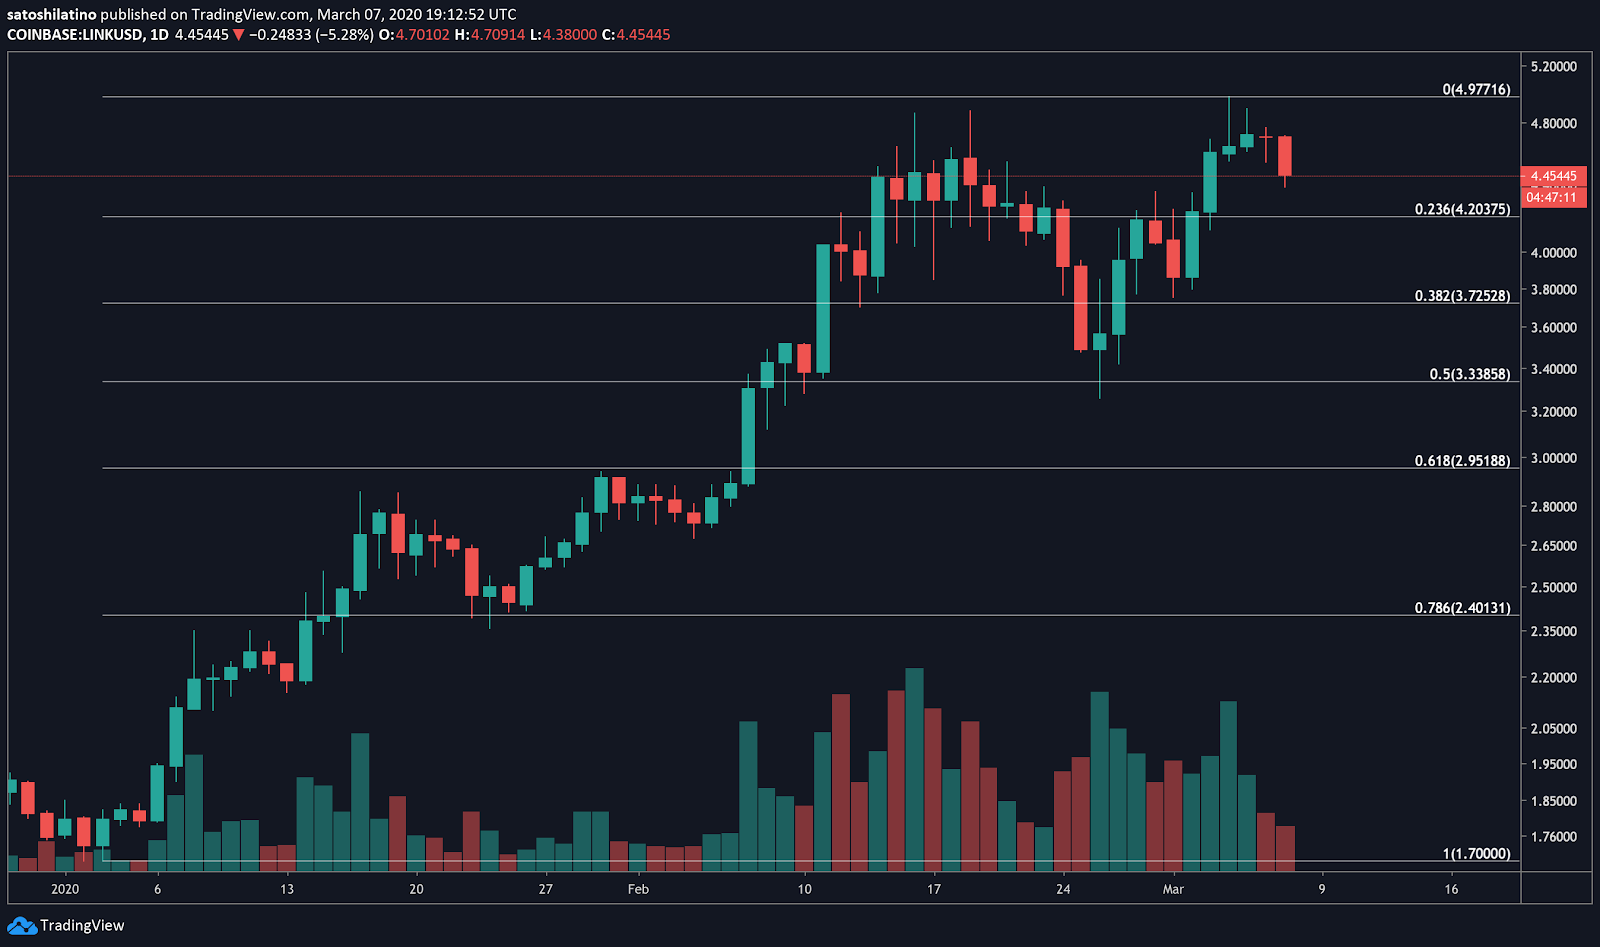
Therefore, a bearish impulse that makes those 2,600 addresses sell their 17 million tokens could be catastrophic. If this happens, LINK could try to find support around the 50% or 61.8% Fibonacci retracement level.
These support barriers sit at $3.3 and $3, respectively.
While LINK’s future from a technical perspective does not look bright, the team behind it has been making significant strides to push forward the utility of this cryptocurrency. Due to these efforts, the bullish perspective cannot be overlooked.
If Chainlink is able to close above the recent high of $5, the next areas of resistance to watch out for sit between $6 and $7.
Now, it is just a matter of time before LINK moves below support or above resistance confirming where it is heading next.