Chainlink Eyes Possible Bull Run
LINK's historical price pattern since April 2018 suggests a possible uptrend on the horizon.

Key Takeaways
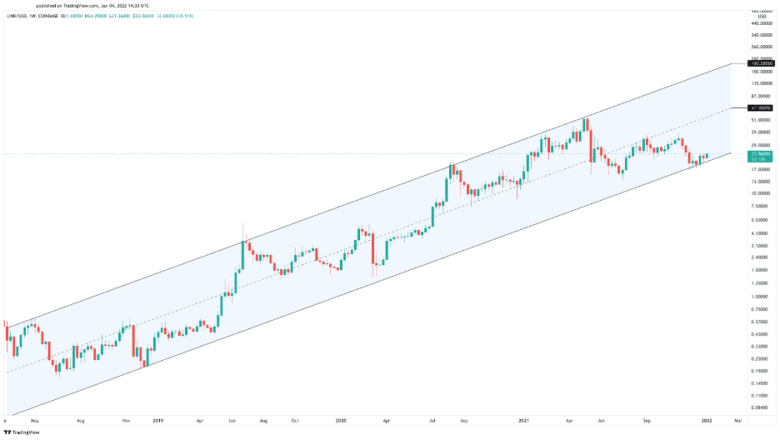
- Chainlink is currently down almost 55% from all-time highs, but has traded in a parallel channel since April of 2018.
- LINK is trading a critical support levels that historically indicate a future uptrend.
- LINK must maintain critical support above $17 on the lower boundary of the parallel channel to validate the bullish thesis.
Share this article
Chainlink appears to be trading at a crucial support level that has previously marked the beginning of a bull run. If history repeats itself, LINK could rise towards new record highs.
Chainlink Reaches Local Bottom
Chainlink appears ready to kick off 2022 on the right foot.
Although LINK is down nearly 55% from an all-time high of about $53 in May 2021, it appears to be holding above a crucial area of support. The lower trendline of a parallel channel, where the token has been contained since April 2018, could serve as a rebound point.
Every time Chainlink has dropped to this technical formation’s lower boundary since then, the downtrend has reached exhaustion before prices move back to the pattern’s middle or upper edge. From this point, LINK usually gets rejected, which is consistent with the characteristics of a parallel channel.
Similar price action to the past four years could see Chainlink rise to the channel’s middle trendline at $67 or even the upper trendline at $180.
The Relative Strength Index is currently hovering around 48, adding credence to the optimistic outlook. This indicator usually remains in the 40-90 range with the 40-50 zone acting as significant support in an uptrend.
The RSI’s recent rebound from the 42 level suggests that Chainlink continues in a bull market and has more legs to go up.
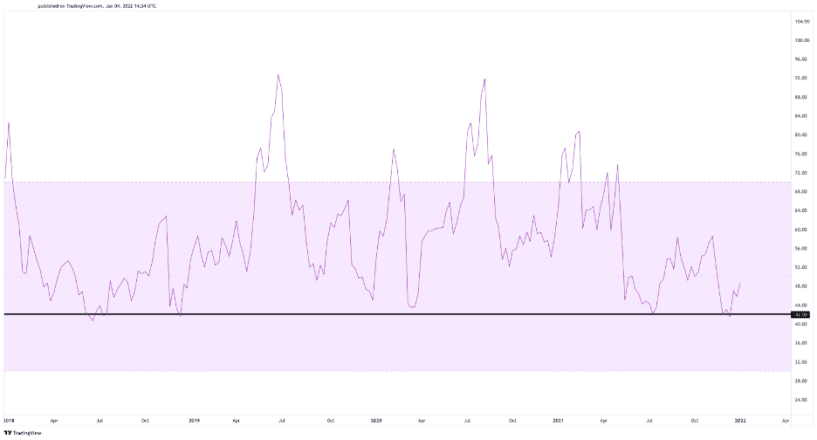
It is worth paying attention to the parallel’s channel lower boundary at $17 and the RSI’s 42 support. Any decisive break among these crucial areas of interest could invalidate the bullish thesis and result in a steep correction. Under such circumstances, Chainlink might dive towards the 200-week moving average at $10.
Disclosure: At the time of writing, the author of this piece owned BTC and ETH.
Share this article
