
Chainlink Reaches New All-Time Highs, Technicals Show Impending Retracement
Chainlink stole the crypto spotlight after rising to new all-time highs. Now it looks like LINK is in for a correction.
Chainlink continues setting new all-time highs, but different fundamental and technical metrics indicate that LINK is ready to retrace.
LINK Crowd Goes Wild After All-Time High
Chainlink captured the market’s attention following an impressive bull run. LINK was able to make a new all-time high of $9.7 on August 4 as buying pressure behind it continues to rise. The steadily increasing prices have not gone unnoticed; LINK-related mentions on different social media networks have gone through the roof.
LunarCRUSH registered a significant spike in the social engagement activity around Chainlink. More than 35.7 million engagements were recorded over the past 24 hours, representing a 105% increase from two days before.
More importantly, roughly 68% of all the social interactions have been bullish about LINK. These include favorites, likes, comments, replies, retweets, quotes, and shares.
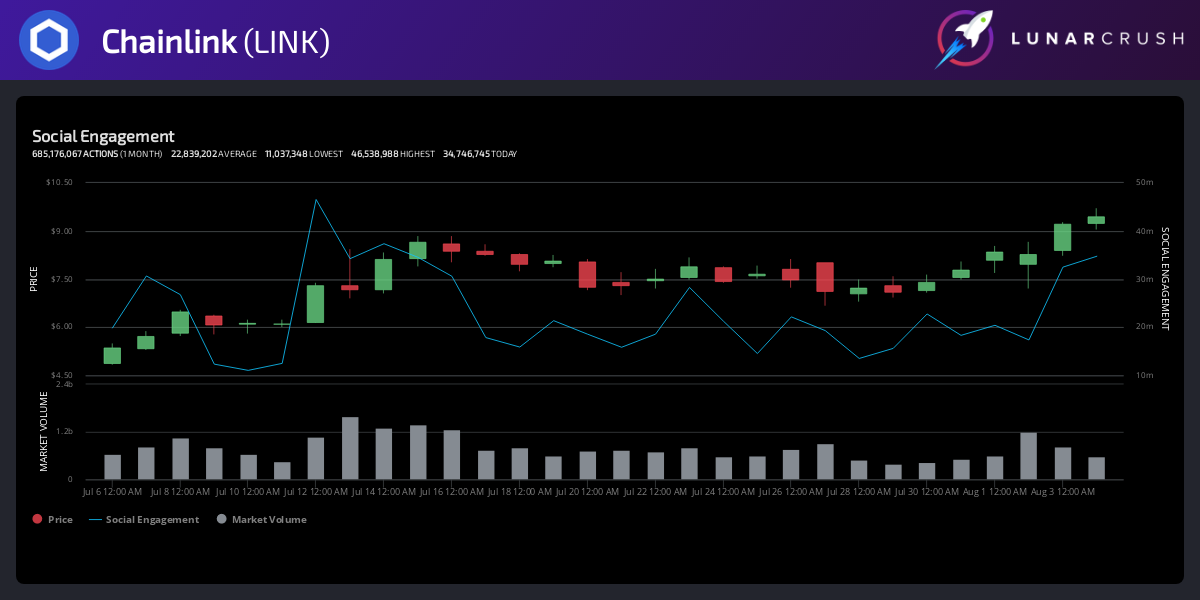
The rising chatter around the decentralized oracles token can be considered a highly concerning sign for its short-term price action. Usually, when retail traders pay heightened attention to a cryptocurrency because of an ongoing pump, it leads to a steep correction. This could be the case for Chainlink.
Bearish Impulse on the Horizon
The TD sequential indicator adds credence to the bearish outlook. This technical index presented a sell signal in the form of a green nine candlestick on Chainlink’s 1-week chart. The bearish formation estimates a one to four weekly candlesticks correction before the uptrend resumes.
Based on historical data, the TD setup has been incredibly accurate at predicting when this altcoin is about to reach local tops and bottoms. When looking at the weekly chart, it even presented a sell signal in early March, just before prices crashed over 62%. For this reason, the current forecast must be taken seriously despite the ongoing uptrend.
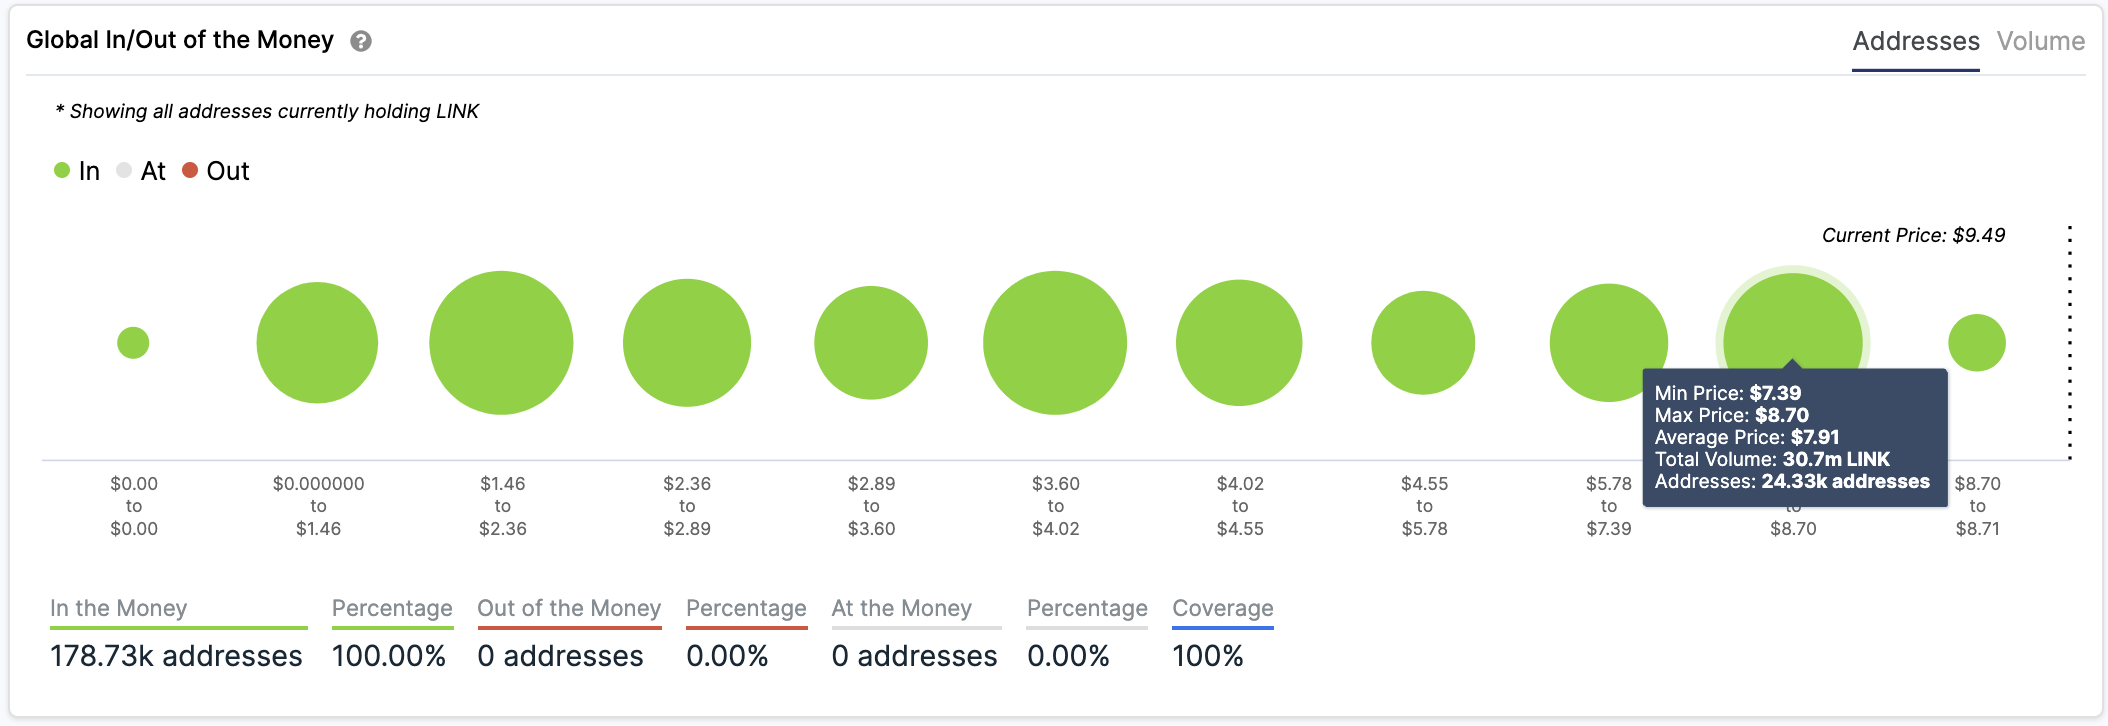
IntoTheBlock’s “Global In/Out of the Money” (GIOM) model reveals that in the event of a correction, the support level that sits between $7.4 and $8.7 may have the ability to hold. Based on this on-chain metric, more than 24,000 addresses had previously purchased over 30 million LINK around this price level.
The significant supply wall could absorb some of the selling pressure. Holders within this price range will likely try to remain profitable in their long positions. They may even buy more tokens to avoid seeing their investments go into the red.
It is worth remembering that Chainlink is currently in price discovery mode, so the probability of a further advance cannot be taken out of the question. If buy orders continue to pile up, this cryptocurrency may rise towards $11. This target is provided by a bull flag pattern that developed on its daily chart.