Coinbase's Stock Is Tanking. What Does That Mean for Bitcoin?
The weak price performance of Coinbase’s stock could act as a warning signal to cryptocurrency investors.

Key Takeaways
- Coinbase’s COIN starting the week by recording a new all-time low of $150.42.
- Prices may trend lower in search of support.
- Bitcoin must hold above $37,500 to avoid the same outlook.
Share this article
Coinbase has seen the market value of its COIN stock drop to a record low, increasing the risk of further losses. Although Bitcoin continues to hold above support, such pessimism could soon affect its price.
Coinbase Crash Spells Disaster for Bitcoin
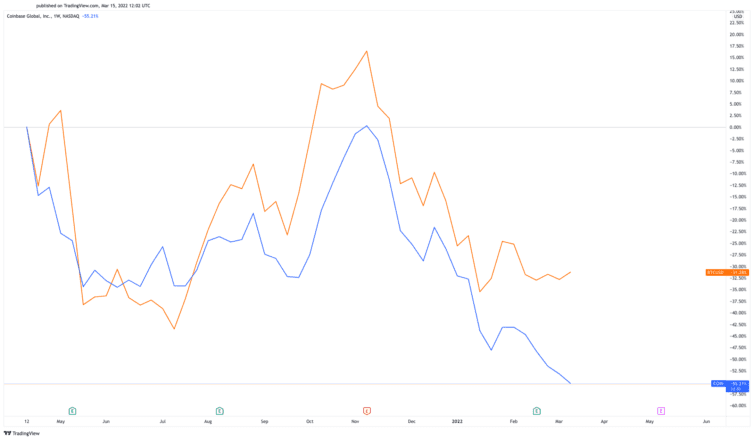
Since Coinbase went public in April 2021, its stock performance has been highly correlated with Bitcoin. After a recent drop in the price of COIN, the top cryptocurrency could also suffer due to the close relationship between the assets.
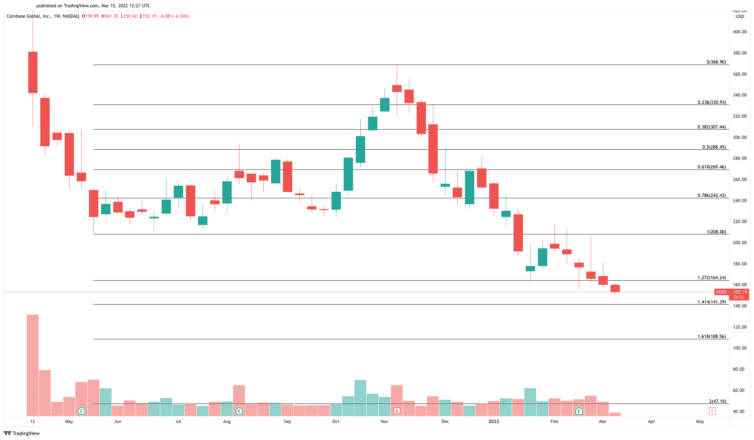
Coinbase saw its stock plummet to a new all-time low of $150.42 Monday. The American cryptocurrency exchange, whose business model and outlook are highly dependent on the performance of Bitcoin, has been locked in a downtrend since early November 2021. As the broader crypto market has tumbled, it’s lost nearly 60% in market value. After experiencing significant losses, it appears that its price could dip lower.
COIN has breached a well-established support level at $164. Now, the Fibonacci retracement indicator, measured from May 19, 2021 low at $208 to the Nov. 9, 2021 high at $368.90, suggests that the stock could drop to form a new low at $141. However, if this interest point fails to serve as a strong foothold, the stock could dip toward the psychological $100 support level.
A pessimistic outlook for COIN could have a significant impact on Bitcoin given the high correlation coefficient of both assets. Since Coinbase went public via a direct listing, its price action has largely mirrored BTC’s market value. Nonetheless, the recent downswing that COIN suffered has not been reflected in the flagship cryptocurrency.
It remains to be seen how the markets will behave after today’s open, and whether Bitcoin could follow suit.
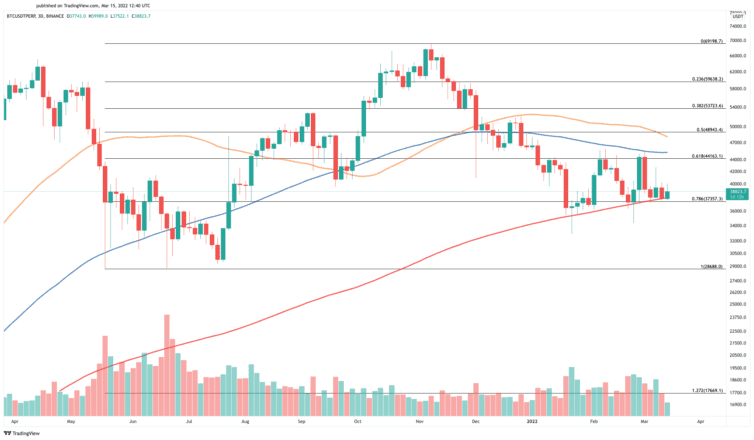
It is worth noting that a spike in selling pressure could translate into significant losses for Bitcoin. The 200-day moving average at $37,500 on the 3-day chart is BTC’s most significant support level. Breaching this demand zone could result in a steep nosedive to $28,700. For this reason, Bitcoin needs to hold above $37,500 to have a shot at breaking the 100-day moving average at $45,000.
Disclosure: At the time of writing, the author of this piece owned BTC and ETH.
Share this article
