Compound, Synthetix Attempt to Break Out
Compound and Synthetix appear to be gaining momentum for a bullish breakout.

Key Takeaways
- Compound is up by nearly 34% over the past three days.
- Synthetix has also risen by more than 26% over the same period.
- COMP and SNX appear to have more room to go up if they keep the recent gains.
Share this article
Compound and Synthetix appear to be headed to greener pastures after posting over 26% gains in the last few days. Still, the pioneer cryptocurrency, Bitcoin, shows a few red flags.
Compound and Synthetix Take the Lead
Compound and Synthetix have seen their native tokens increase significantly in market value, outperforming some of the most popular DeFi projects.
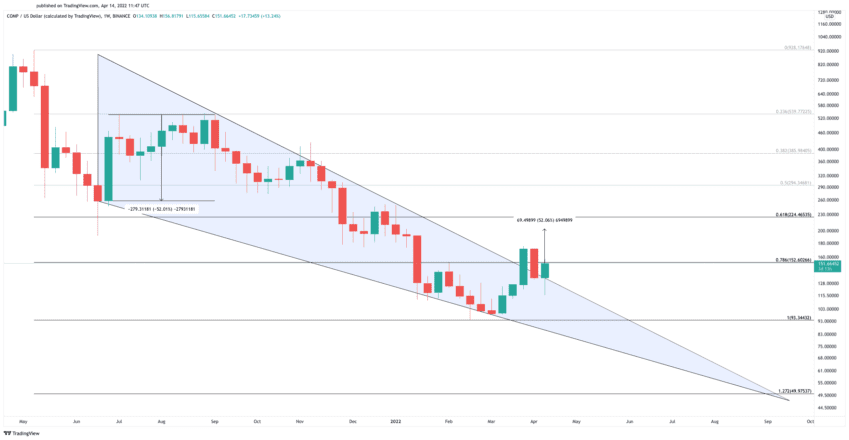
COMP has surged by nearly 34% over the past three days and is now testing the $152 resistance level. This hurdle is significant for the DeFi token because it sits around the descending trendline of a falling wedge that has been forming on the weekly chart since late June 2021.
A sustained weekly candlestick close above $152 could signal a breakout from the consolidation pattern. Under such circumstances, sidelined investors could re-enter the market, pushing COMP by roughly 52% toward $224.50.
It is worth noting that this is the third consecutive time that Compound has tried to breach the $152 resistance level. For this reason, it is imperative to wait for a decisive close above it to target higher highs.
Failing to print a weekly candlestick close above $152 could result in a steep correction to the wedge’s descending trendline at $93. If this support level breaks, the losses can extend toward $50.
SNX has also posted significant gains over the past three days. The DeFi token saw its price rise by more than 26% after testing the middle trendline of a parallel channel where it has been contained since December 2020.
Price history shows that Synthetix tends to surge to the channel’s upper boundary when the pattern’s middle trendline acts as support. Similar price action could result in a 37% upswing to $7.70. But if this resistance level breaks, SNX might enter a new uptrend to $17.50.
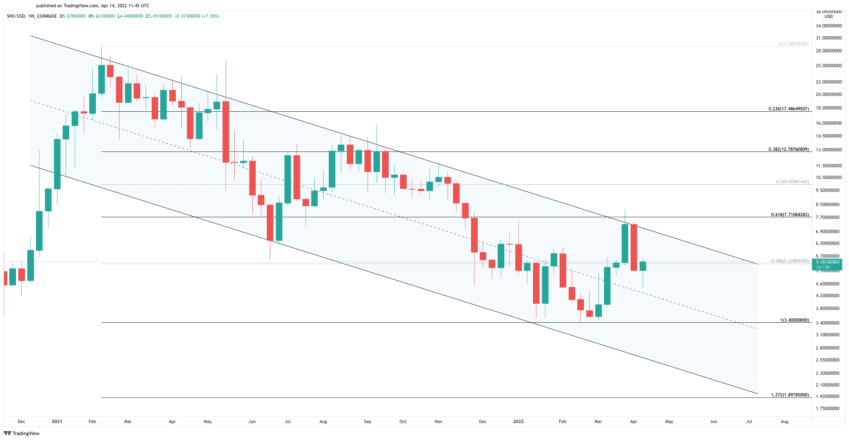
It is worth noting that a rejection from the $7.70 resistance level can result in a steep correction to the channel’s middle or lower trendline. These support levels sit at $3.40 and $2, respectively.
Disclosure: At the time of writing, the author of this piece owned BTC and ETH.
Share this article
