Cosmos Price Analysis ATOM / USD: Gazing Into Infinity
ATOM is particle-ularly bullish right now.

Share this article
- Cosmos has turned bullish over the short-term and the medium-term
- The four-hour time shows that a bearish head and shoulders pattern and a bullish double-bottom pattern is in play
- The daily time frame shows that a major technical breakout could occur if the $3.15 resistance level is broken.
Cosmos is staging a minor technical correction on Wednesday, after the popular cryptocurrency turned lower alongside the broader market. After coming under pressure towards the September price close, the ATOM / USD pair recently rallied to its highest trading level since September 21st.
Both short and medium-term technical analysis is currently showing that the ATOM / USD pair has significant upside potential if bulls can gather strength above the $3.15 level. A sustained break above this level could propel the cryptocurrency towards the $5.00 level.
The ATOM / USD pair had been enjoying a strong short-term recovery and has also been one of the top performing cryptocurrencies inside the top thirty by market cap recently. In percentage terms, Cosmos has gained over fifty percent from its September monthly low and trades over fifteen percent since its October price open.
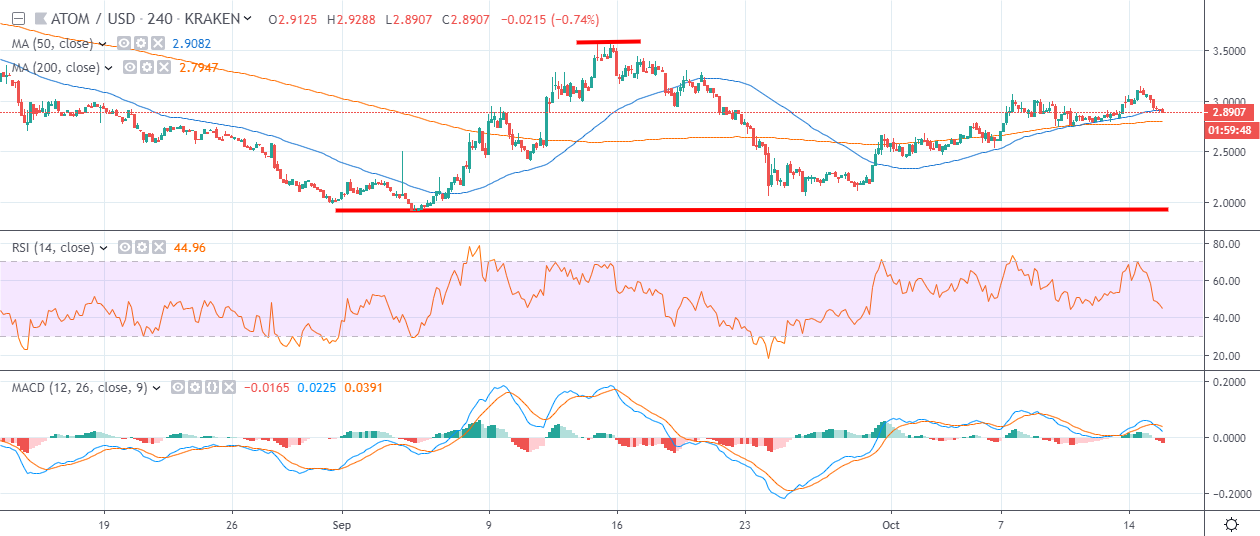
Looking at the four-hour time frame, a bearish head and shoulders pattern is currently in play, with bulls needing to rally the ATOM / USD pair above the $3.50 level to invalidate the bearish pattern. The invalidation target of the head and shoulders pattern would take the cryptocurrency toward the $5.00 level.
Looking at the near-term bullish case for Cosmos, a double-bottom pattern has also been created, price is also still trading above its 200-period moving average on the four-hour time frame.
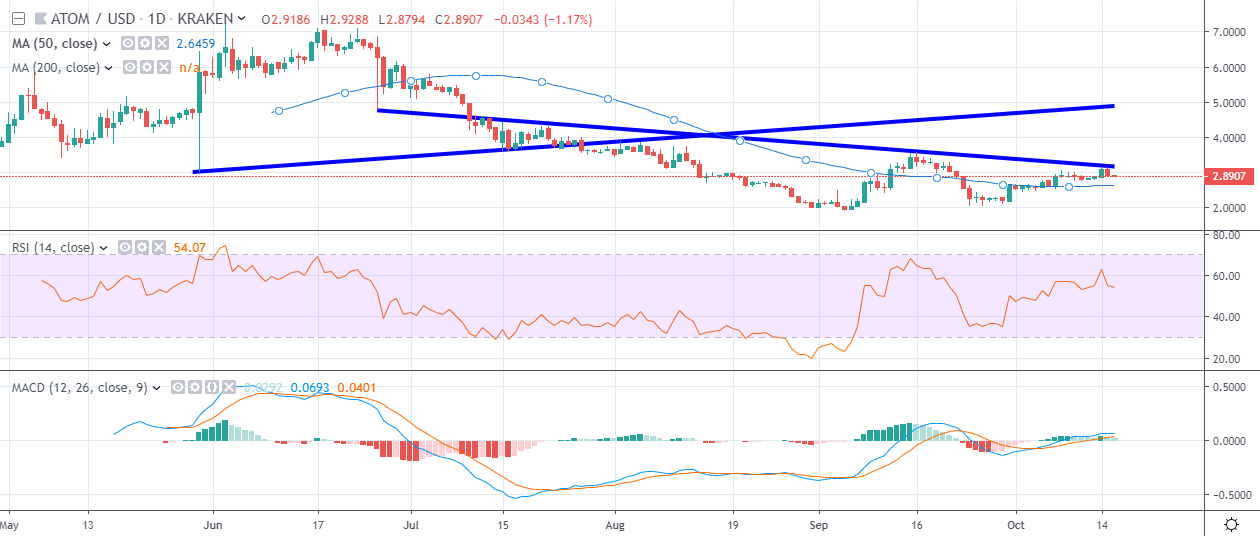
The daily time frame shows that a major trendline breakout could occur if the $3.15 level is broken, with the mentioned time frame once again showing the $5.00 level as the likely upside target.
The four-hour and daily time frame charts both show that a sustained move under the $2.65 level would put the ATOM / USD pair back under downside pressure and reduce the chances of a bullish breakout.
According to the latest sentiment data from TheTIE.io, the short-term sentiment towards Cosmos is bearish, at 43.00 %, while the overall long-term sentiment towards the cryptocurrency is resoundingly bullish, at 63.50%.
Upside Potential
The four-hour time frame highlights that bulls need to move price above the $3.15 level to encourage fresh technical buying. Once above the $3.15 level, the ATOM / USD pair has limited technical resistance until the $3.50 level.
The daily time frame also highlights the $3.15 level as major trendline resistance. A breakout above key trendline resistance could propel the ATOM / USD pair towards the July 9th swing-high.
Downside Potential
The lower time frames are currently showing that the short-term trend remains bullish while price trades above the $2.80 level. In the near-term, the $2.88 level is key support.
The daily time frame is showing that the medium-term bullish case for the ATOM / USD pair remains strong while price trades above the $2.65 support level.
Summary
Cosmos shows tremendous bullish potential over the short and medium-term if bulls can rally the cryptocurrency above the $3.15 level.
The overall upside projection of the potential bullish breakout would add more than fifty percent to the value of the popular cryptocurrency.
To get a quick refresher course on Cosmos check out our coin guide here. Our SIMETRI Research team has also published a full digital asset report on Cosmos.
Share this article
