Dash Price Analysis: Accumulating Losses

Share this article
- Dash has a bearish short-term and medium-term trading bias
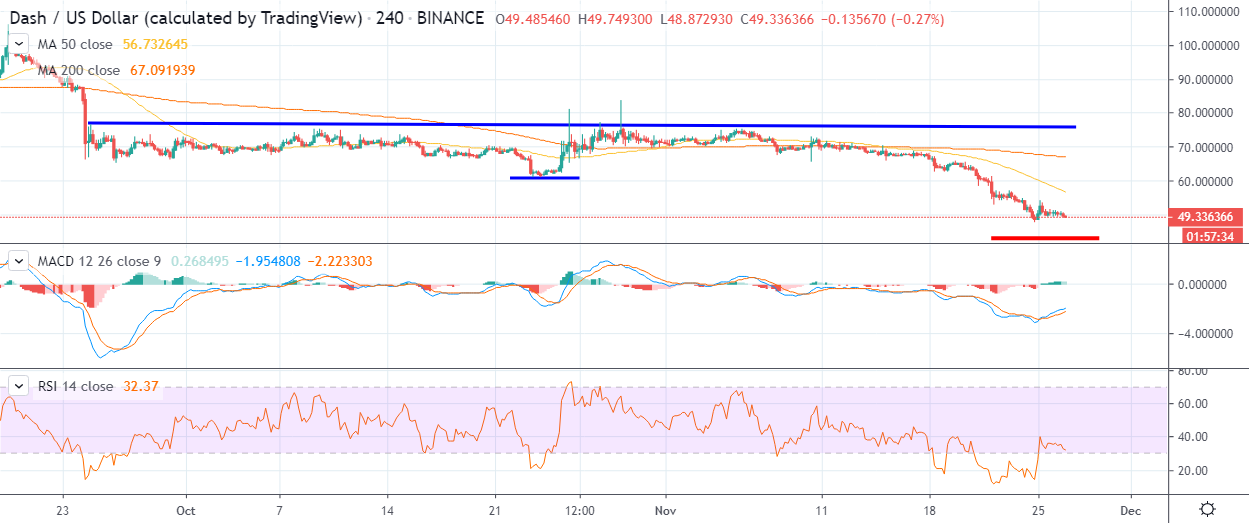
- The four-hour time frame shows that a bullish inverted head and shoulders pattern has been invalidated
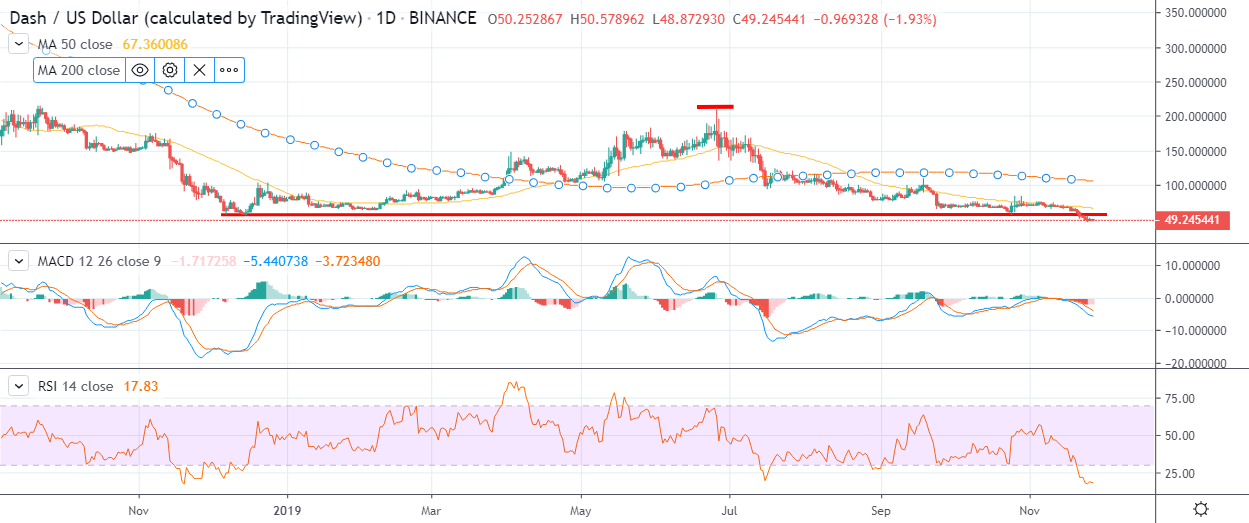
- The daily time frame shows that a bearish head and shoulders pattern has been triggered
Dash remains under heavy downside pressure as the coin fell to levels not seen since Feb. 2017.
The DASH/USD pair has declined by over 30 percent since the start of November and is now trading over 50 percent below its current 2019 trading peak.
Technical analysis shows that the DASH/USD pair is heavily bearish while trading below the $57.00 level and is at risk of further protracted losses towards fresh multi-year trading lows.
The four-hour time frame shows that an inverted head and shoulders pattern has recently been negated, with the invalidation target located around the $42.00 level.
The daily time frame shows that a complex head and shoulders pattern has recently been triggered following the breakout under the $57.00 level.
The bearish head and shoulders pattern has been forming since 2016, with its overall downside target extend well-below the DASH/USD pair’s all-time trading low.
DASH desperately needs to start to even out above the $57.00 level in order to stabilize itself and secure its medium to long-term prospects.
The Relative Strength Index on the daily time frame shows that the cryptocurrency is now at its most oversold reading since the cryptocurrency began trading.
According to the latest sentiment data from TheTIE.io, the short-term sentiment towards Dash is neutral at 43.50 %, while the overall long-term sentiment towards the cryptocurrency is neutral at 23.50%.
Upside Potential
The four-hour time frame shows that key technical resistance is located at the $57.00 and $68.00 levels. Buyers ideally need to rally price above both these levels in order to form a large reversal pattern.
Key technical resistance over the medium-term is located at the $75.00 and $83.00 levels.
Downside Potential
The four-hour time frame is showing that the DASH/USD pair has strong medium-term technical support around the $47.00 and $42.00 levels.
Critical long-term technical support for the DASH/USD pair is located at the $33.00 level.
Summary
Dash is at risk of further protracted losses below the $50.00 level, with the $42.00 level the likely near-term bearish target.
Failure to rally the cryptocurrency back above the $57.00 level should be extremely negative for the DASH/USD pair over the medium to long-term.
Share this article
