Dash Price Analysis DASH / USD: Sprouting Higher
A bullish pattern is forming for Dash.

Share this article
- Dash has a bullish short-term trading bias, but still remains bearish over the medium-term
- The four-hour time frame shows a bullish inverted head and shoulders pattern
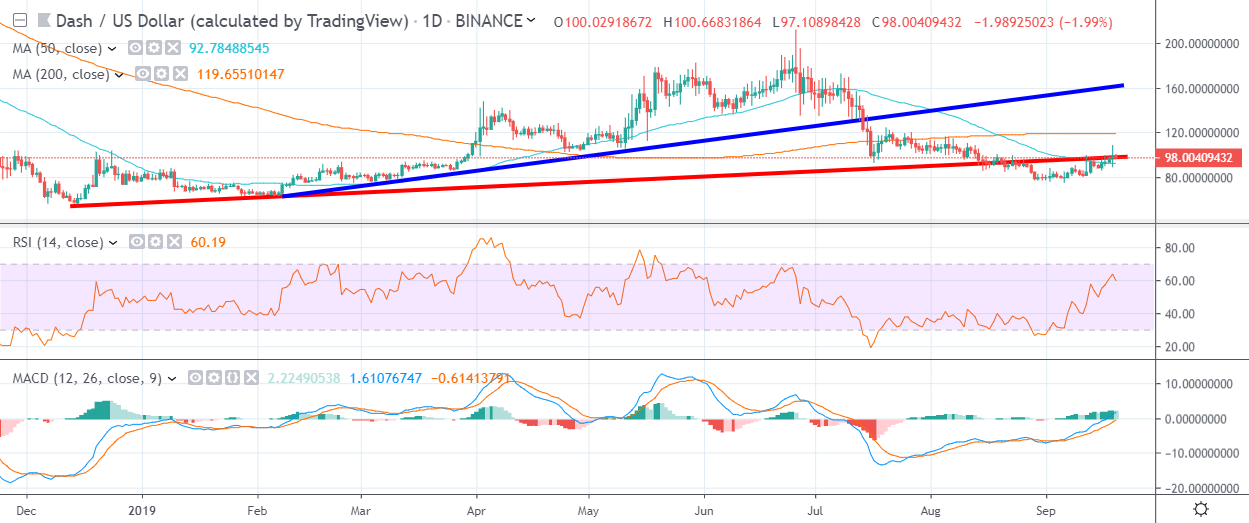
- The daily time frame highlights a long-term rising trendline as a possible bullish target around the $113.00 level
Dash is consolidating in an increasingly narrow trading range, as the popular cryptocurrency fails to rally despite have impressive technicals across both the lower and higher time frames.
The DASH / USD pair has been trapped in a period of price consolidation since October 27th, after quickly recovering from the $57.00 level. On a monthly basis the cryptocurrency is almost completely flat, trading down around ten percent from its yearly opening price.
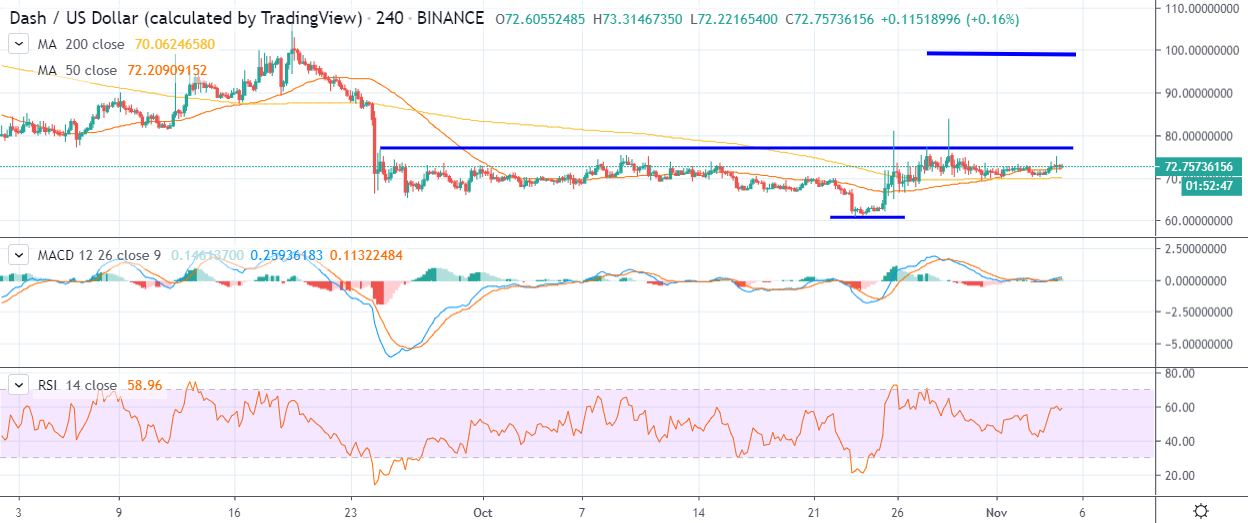
Both the four-hour time frame and daily time frame indicate that the DASH / USD pair has solid upside potential if traders starts can rally the cryptocurrency above the $76.50 level.
The four-hour time frame shows that a breakout above the $76.50 level would ignite a bullish inverted head and shoulders pattern that could help the DASH / USD pair soar in value towards the $100.00 level.
According to the size of the pattern, the DASH / USD would add roughly 38% to its value if the bullish breakout occurred. At present, its 50-day moving average is capping upside gains around the $73.00 level.
The daily time frame highlights the $113.00 level as the medium-term upside objective if a breakout finally occurs over the coming days and weeks.
Longer-term rising trendline resistance and the DASH / USD pair’s 200-day moving average are both converging around the $113.00 level, making it the most likely upside target if a rally above the $100.00 level occurs.
With green shoots spreading through the broader crypto market it is highly probable that a rally will be forthcoming if buyers can force price above the $76.50 level.
According to the latest sentiment data from TheTIE.io, the short-term sentiment towards Dash is bullish, at 61.00 %, while the overall long-term sentiment towards the cryptocurrency is very bearish, at 21.00%.
Upside Potential
The four-hour time frame shows that a large inverted head and shoulders pattern has formed, with the $76.50 level acting as the neckline of the bullish pattern.
Key technical resistance above the bullish pattern is currently located at the $84.00 and the $95.00 levels. Medium-term resistance for the DASH / USD pair is found at the $113.00 and $120.00 levels.
Downside Potential
The four-hour time frame is showing that the DASH / USD pair’s 200-period moving average is providing the strongest form of short-term technical support, around the $70.00 level.
The daily time frame shows that a break below the $65.00 level would be extremely bearish for the DASH / USD pair and could expose a possible decline towards the $58.00 level.
Summary
The DASH / USD pair needs to make a sustained advance above the $76.50 level in order to prompt a technical rally that could eventually push the cryptocurrency back towards the $113.00 resistance level.
Short-term bulls now need to take the lead and break the cryptocurrency away from the recent period of sideways trading action.
To get a quick refresher course on Dash check out our coin guide here.
A deep dive look into DASH and Dashpay is available in our DARE.
Share this article
