Decentraland, The Sandbox Look Poised to Soar
Decentraland and The Sandbox should show an optimistic outlook if buy orders increase.

Key Takeaways
- Decentraland continues to trade around its resistance level.
- The Sandbox appears to have broken out without bullish continuation.
- Both MANA and SAND are awaiting a spike in buy orders to advance further.
Share this article
Decentraland and The Sandbox appear to be on the brink of a bullish breakout. Still, both Metaverse tokens will need a spike in buying pressure to achieve their upside potential.
Decentraland Tests Resistance
Decentraland continues to consolidate within a tight range while attempting to slice through resistance.
The Metaverse game’s MANA token has seen its price action getting narrower over time. In the past week, MANA has mostly traded between $2.60 and $2.76 without providing a clear direction.
From a technical perspective, it appears to be stuck within a symmetrical triangle that has been forming since late January. A descending trendline has developed along with the swing highs, while an ascending trendline formed along with the swing lows. This continuation pattern estimates that a decisive daily close above $2.70 could propel MANA to $3.80.
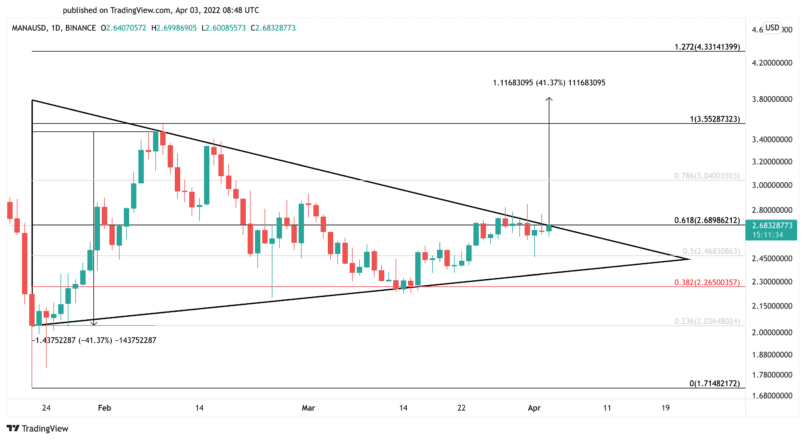
Still, Decentraland must continue to trade above $2.27 to validate the bullish outlook. Failing to do so could encourage market participants to exit their long positions, adding pressure on the token. Under such circumstances, MANA could retrace to $2 or even $1.72.
The Sandbox Prepares to Surge
The Sandbox could be positioning itself for a bullish impulse, but it’s lacking the upward pressure it needs to rise.
The Sandbox’s SAND token has remained stagnant over the past week after slicing through a critical resistance area. It’s been consolidating between $3.30 and $3.70 while maintaining a bullish bias.
SAND appears to have broken out of a descending triangle that developed on its daily chart since mid-November 2021. The technical formation anticipates that a spike in buying pressure around the current price levels could propel SAND toward $5.50, representing a 68% increase.
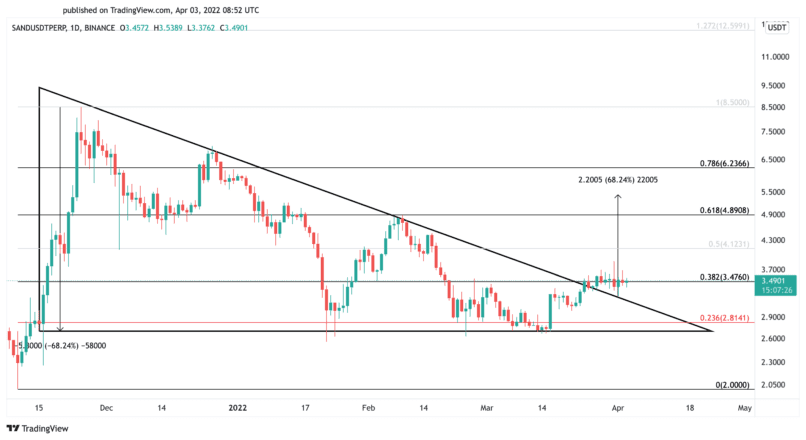
Given the low trading volume SAND has seen over the past week, the Metaverse token could see an invalidation of the bullish thesis. A downswing that pushes SAND below $2.81 could be a sign that prices will dip lower. SAND could then crumble under pressure and test the $2 support level.
Disclosure: At the time of writing, the author of this piece owned BTC and ETH.
Share this article
