
Ethereum, EOS, NEO Awaiting Retracement, Show Trading Indicators
Similar bearish patterns can be seen throughout the market
Greed is taking over the price action for Ethereum, EOS, and NEO, suggesting a coming correction.
Ethereum Prepares for a Correction
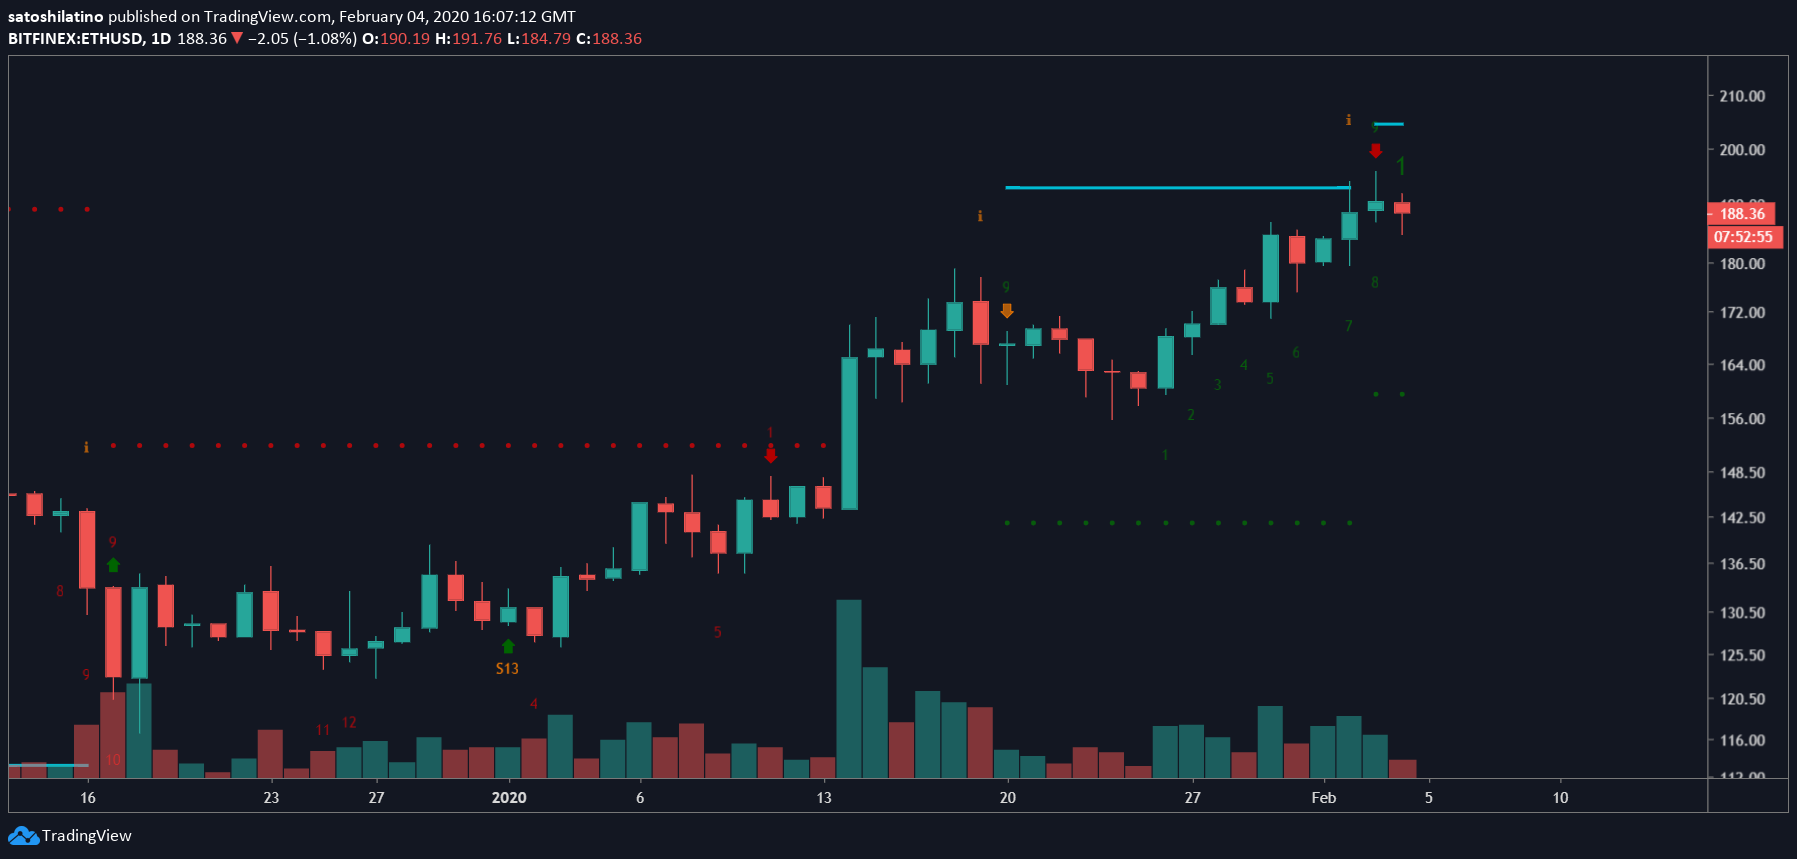
Ethereum is going through a massive bullish impulse with its price surging by 70% since mid-December. Since then, Ether went from trading at a low of $117 to a high of $196 early February. Despite the substantial momentum, it seems ETH is reaching an exhaustion point.
In fact, the TD sequential indicator recently presented a sell signal on ETH’s 1-day chart. The bearish formation was given in the form of a green nine candlestick. Now, this technical index estimates that Ether is bound for a one to four candlesticks correction or the beginning of a new bearish countdown.
A red two candlestick trading below a preceding red one candle could serve as confirmation of the sell signal.
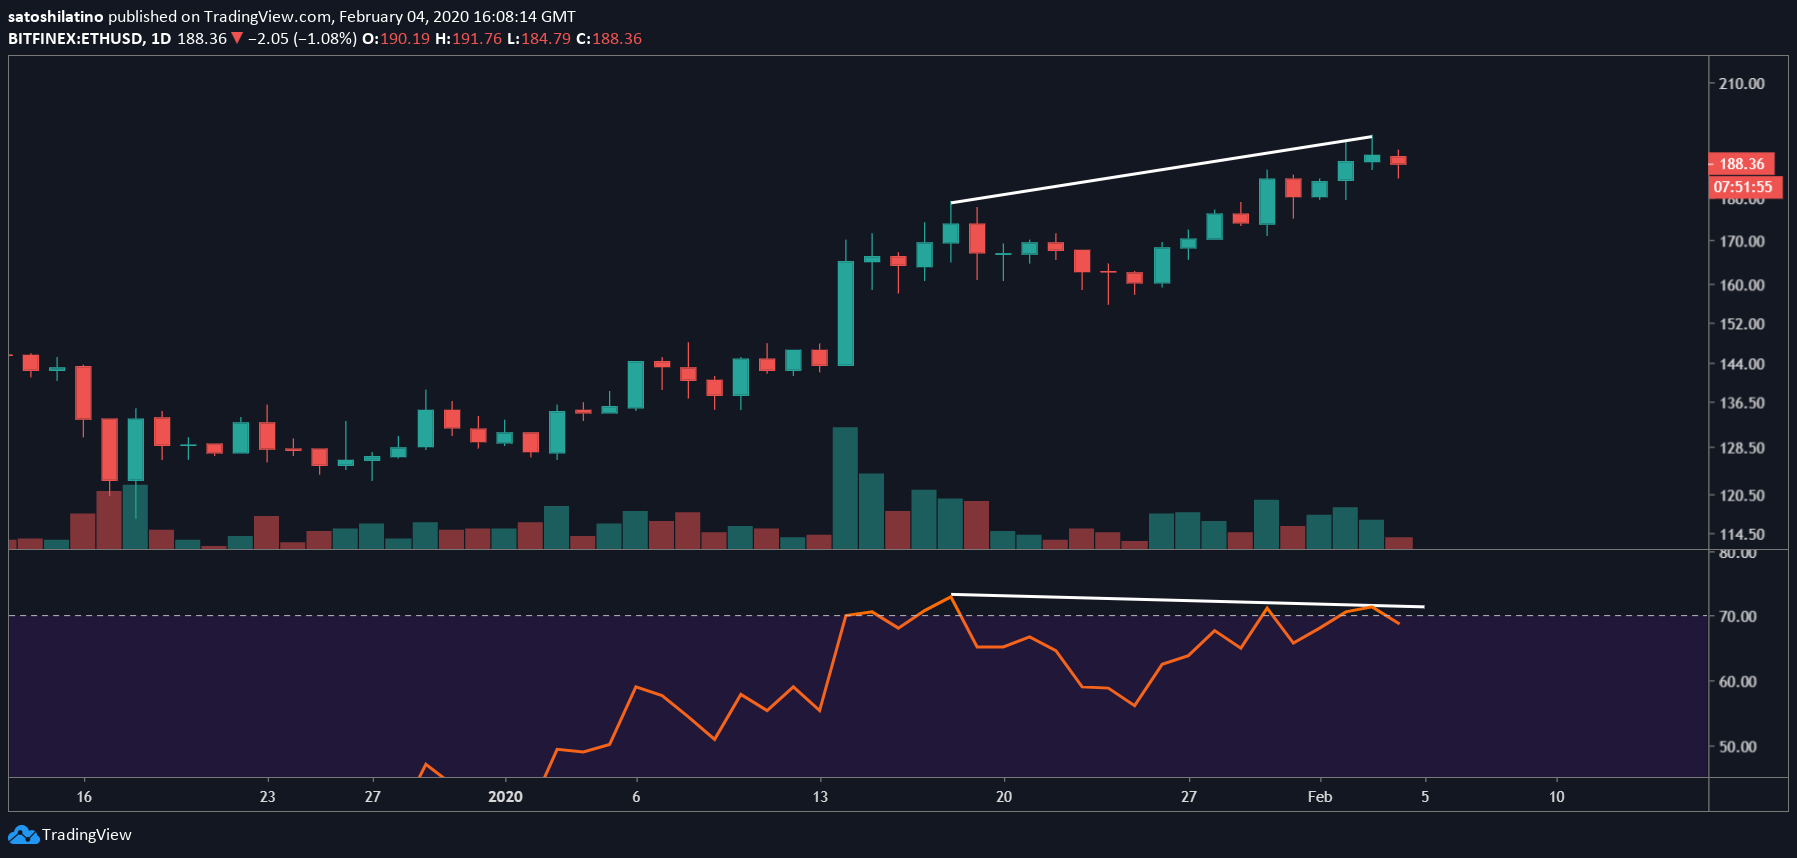
Adding credence to the bearish outlook, a bearish divergence between the price of Ether and the Relative Strength Index (RSI) is forming within the same time frame.
Divergences occur when the price of an asset is making a series of higher highs while the RSI is making lower highs. Although this technical pattern does not provide a precise selling point, it is a sign that the uptrend is reaching an exhaustion point.
A spike in the selling pressure behind ETH could push it down to the 78.6% Fibonacci retracement level. Closing below this significant level of support would increase the odds for a further decline to the 61.8% or 50% Fibonacci retracement level. These support barriers sit at $165 and $156, respectively.
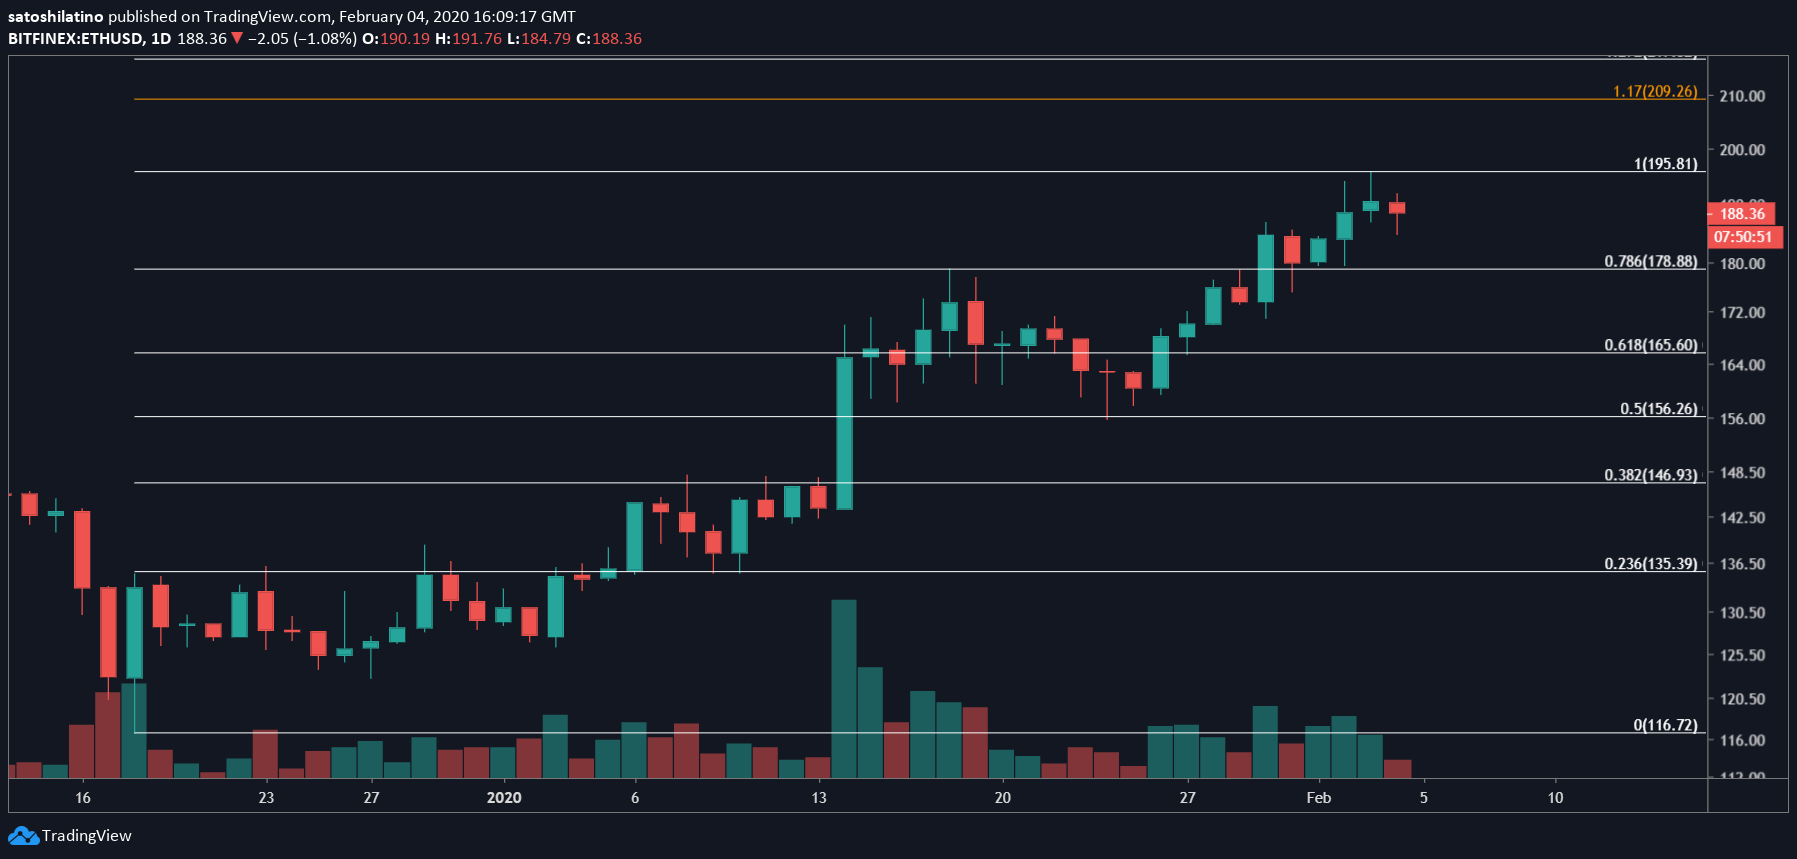
Nevertheless, a close above the recent high of $196 would likely invalidate the pessimistic outlook. Such a bullish impulse could take Ethereum to a new yearly high of $209 or $223.
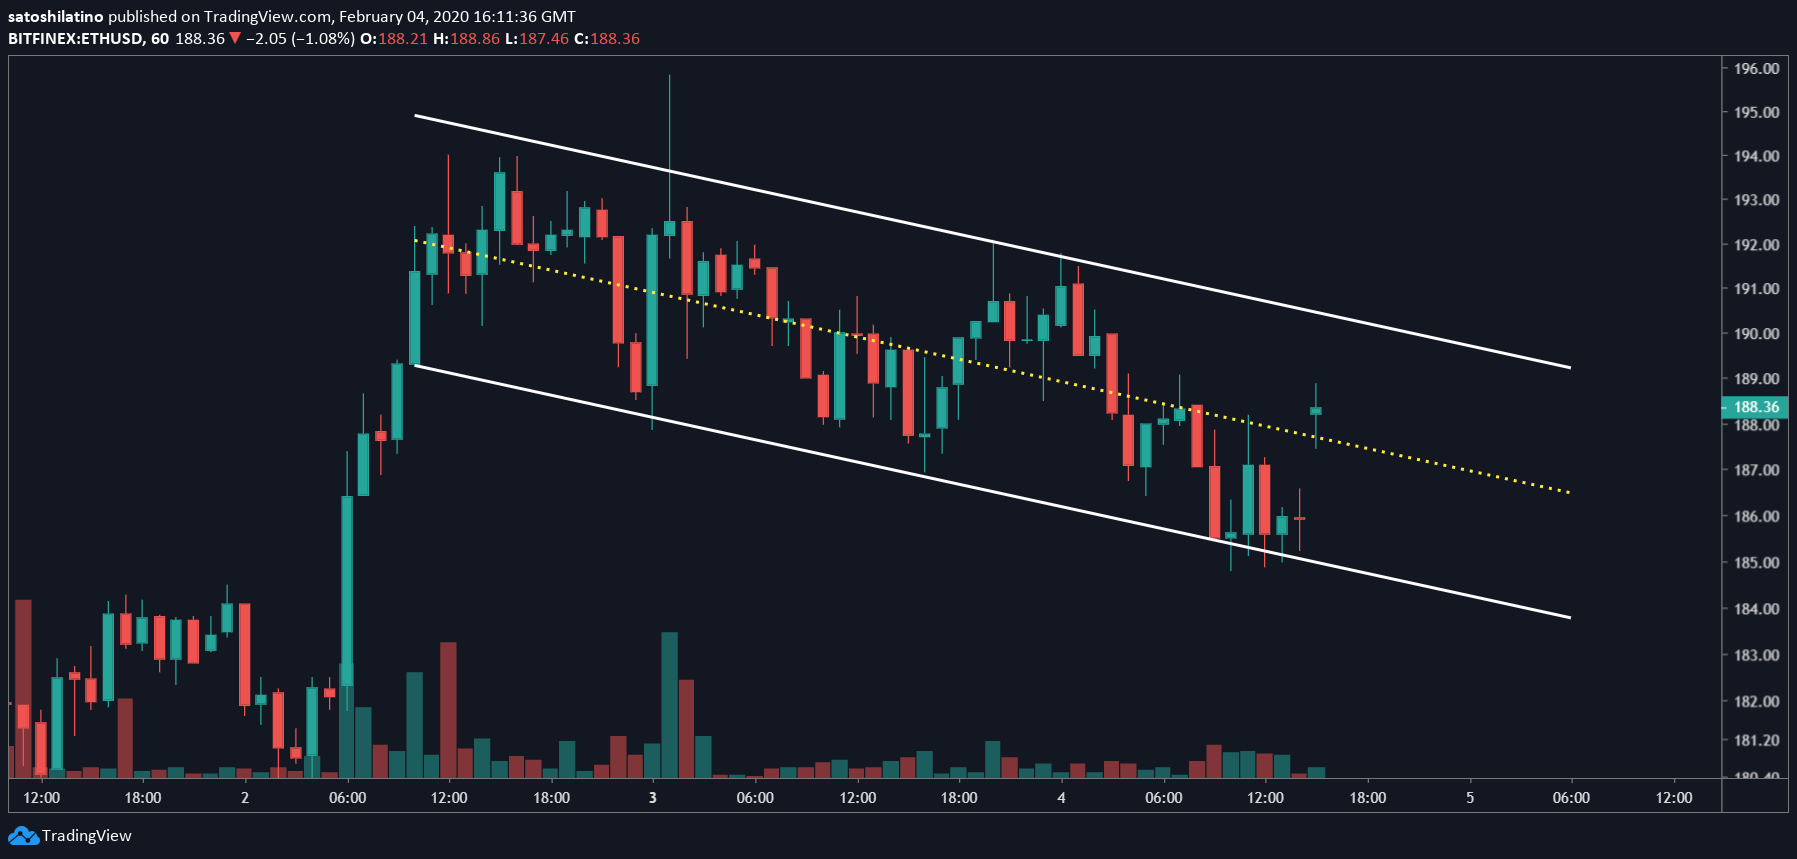
It is worth noting that from a lower time frame, such as the 1-hour chart, Ether has been contained in a descending parallel channel for the last two days. Since then, each time ETH hits the bottom of the channel, it bounced off to the middle or the top. Conversely, when it surges to the upper boundary of the channel, it retraces to the middle or the lower boundary. Breaking out of this channel would determine where this Ethereum is heading next.
EOS Reaching Exhaustion
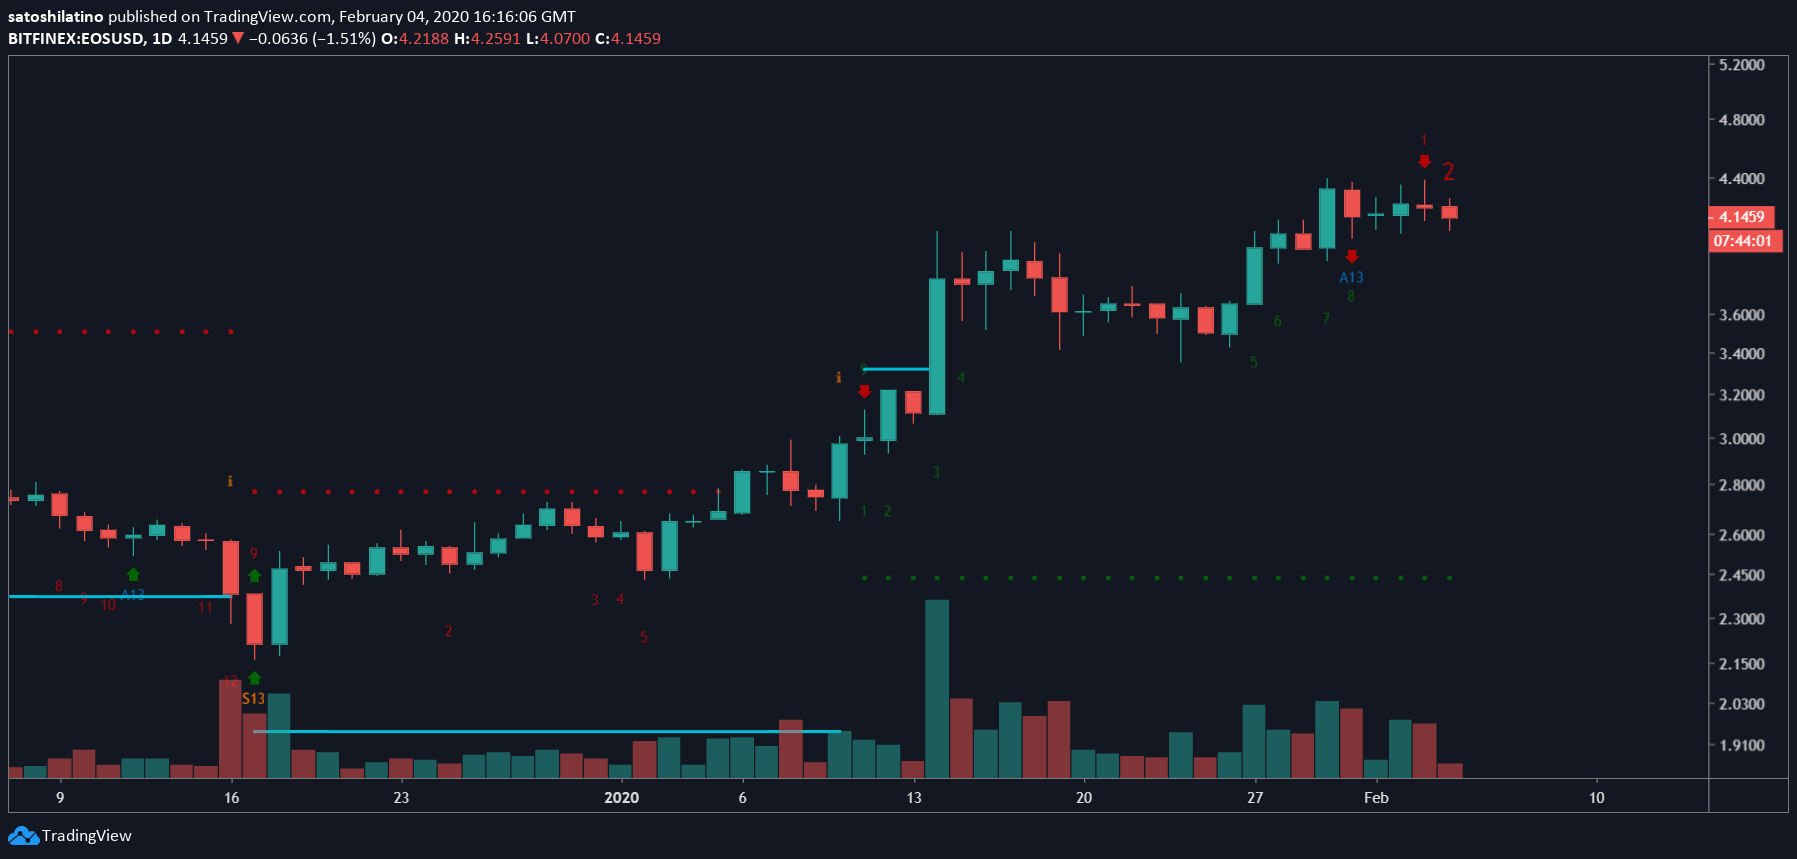
Like Ethereum, EOS entered a bull rally that has seen its price double since mid-December 2019. This cryptocurrency skyrocketed from $2.16 all the way up to $4.40. Now, the TD sequential indicator is estimating that a correction could be under way based on the 1-day chart.
This technical index presented two bearish signals over the last few days: an aggressive thirteen on Jan. 31 and a green nine Feb. 3 that transitioned into a red one candlestick. These bearish patterns predict a one to four candlestick correction, but a high spike in sell orders could trigger a new bearish countdown.
Since the current candlestick is a red two trading below a preceding red one candle, the bearish formation has been confirmed.
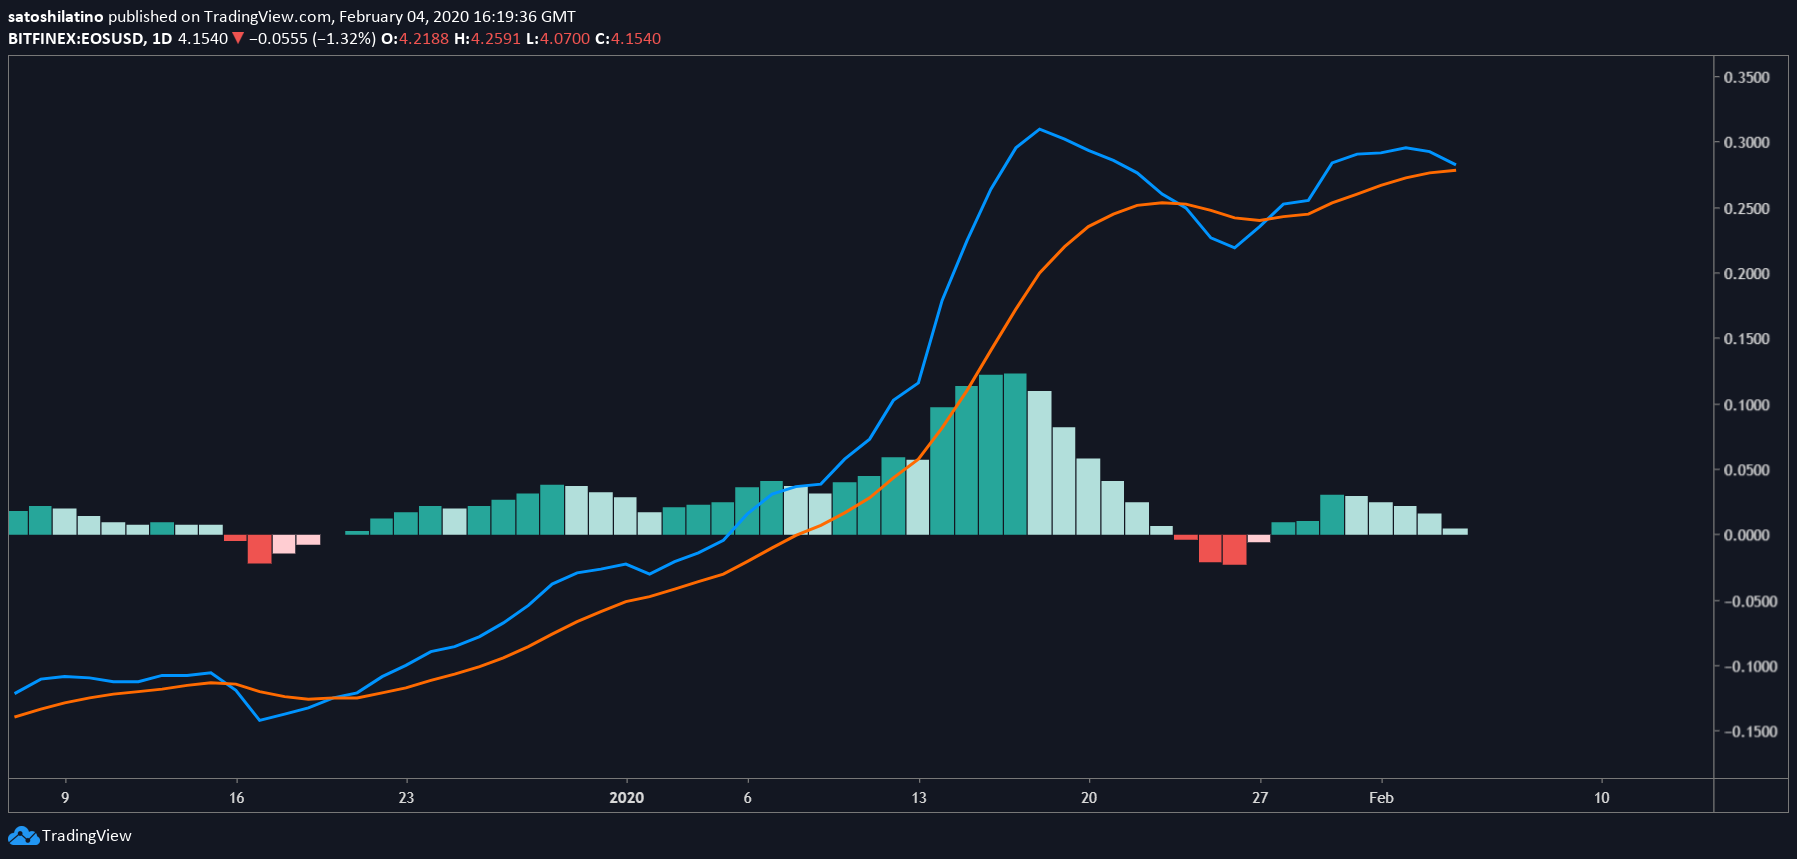
Additionally, the moving average convergence divergence, or MACD, appears to be turning bearish within the same time frame. This technical indicator follows the path of a trend and calculates its momentum. As the 12-day EMA approaches the 26-day EMA, the odds for a crossover increase, adding credence to the bearish outlook.
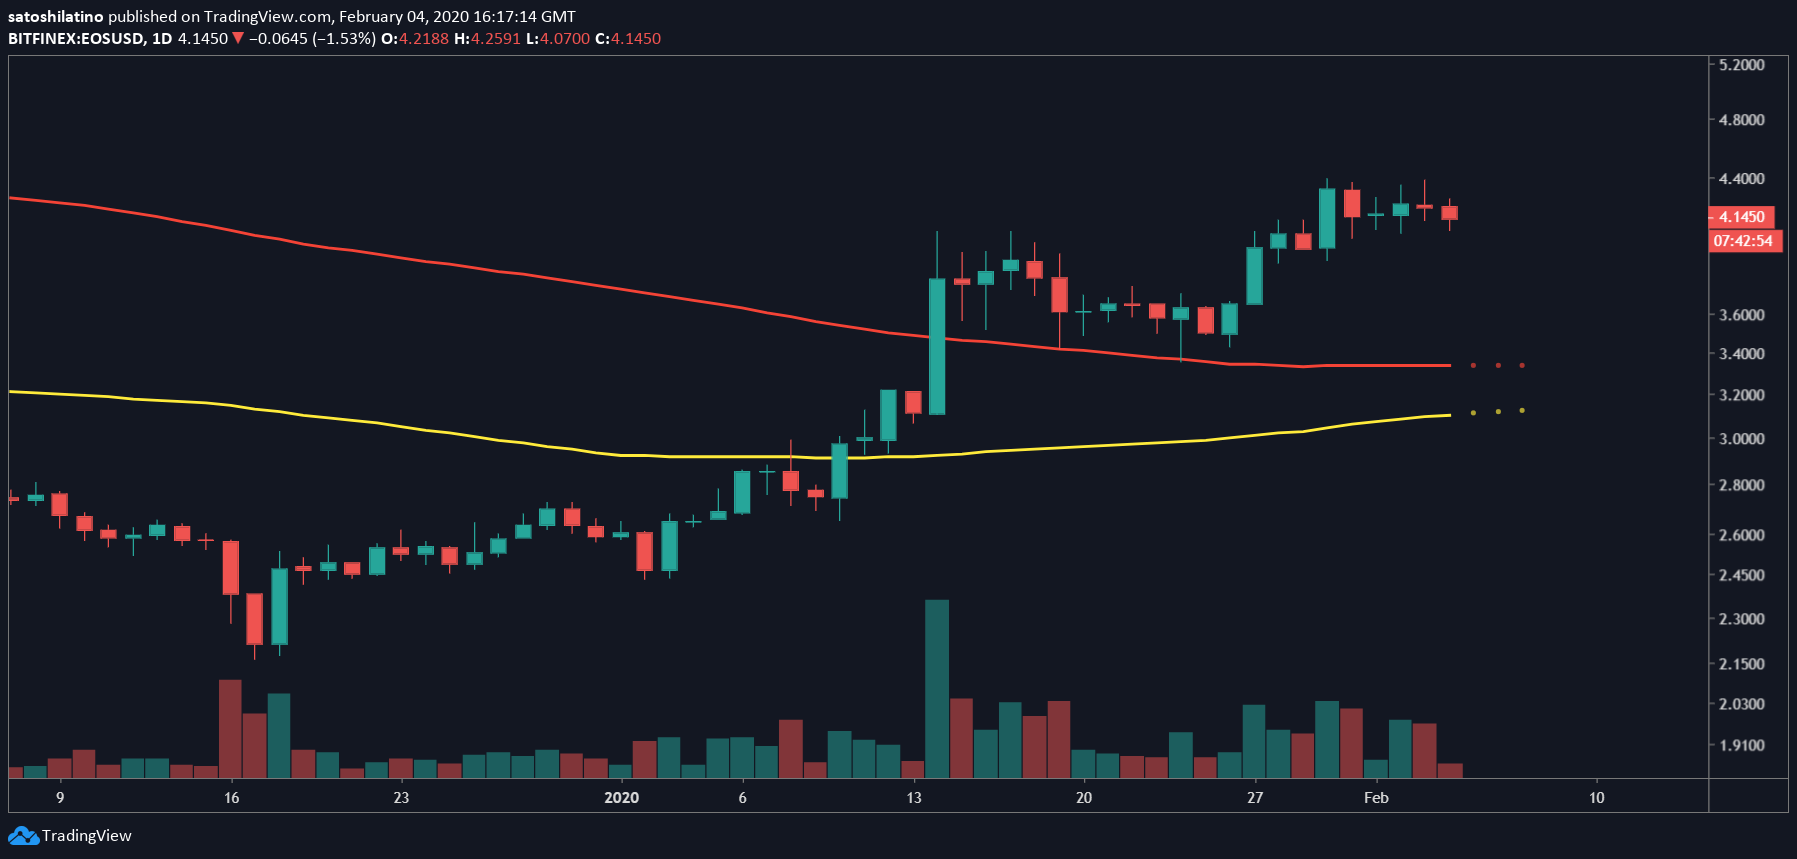
The most significant level of support that could prevent EOS from a steeper decline is given by the 200-day moving average. This price hurdle is currently hovering around $3.30 and could represent a 20% plunge from the current price levels.
NEO Could Retrace, Remains Bullish
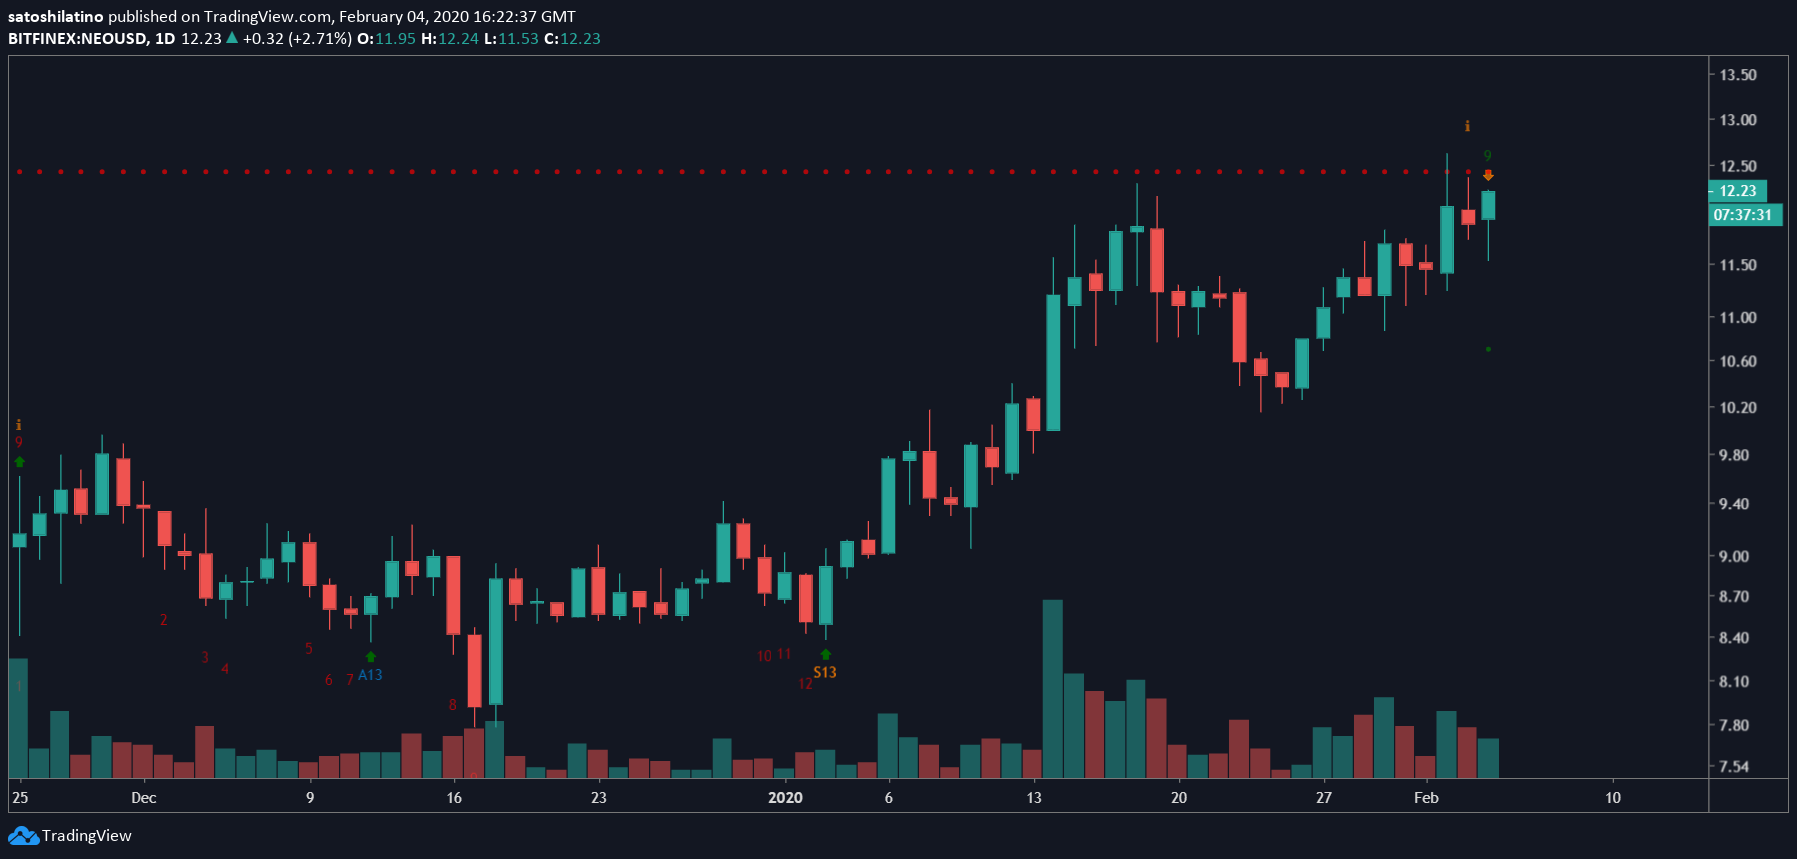
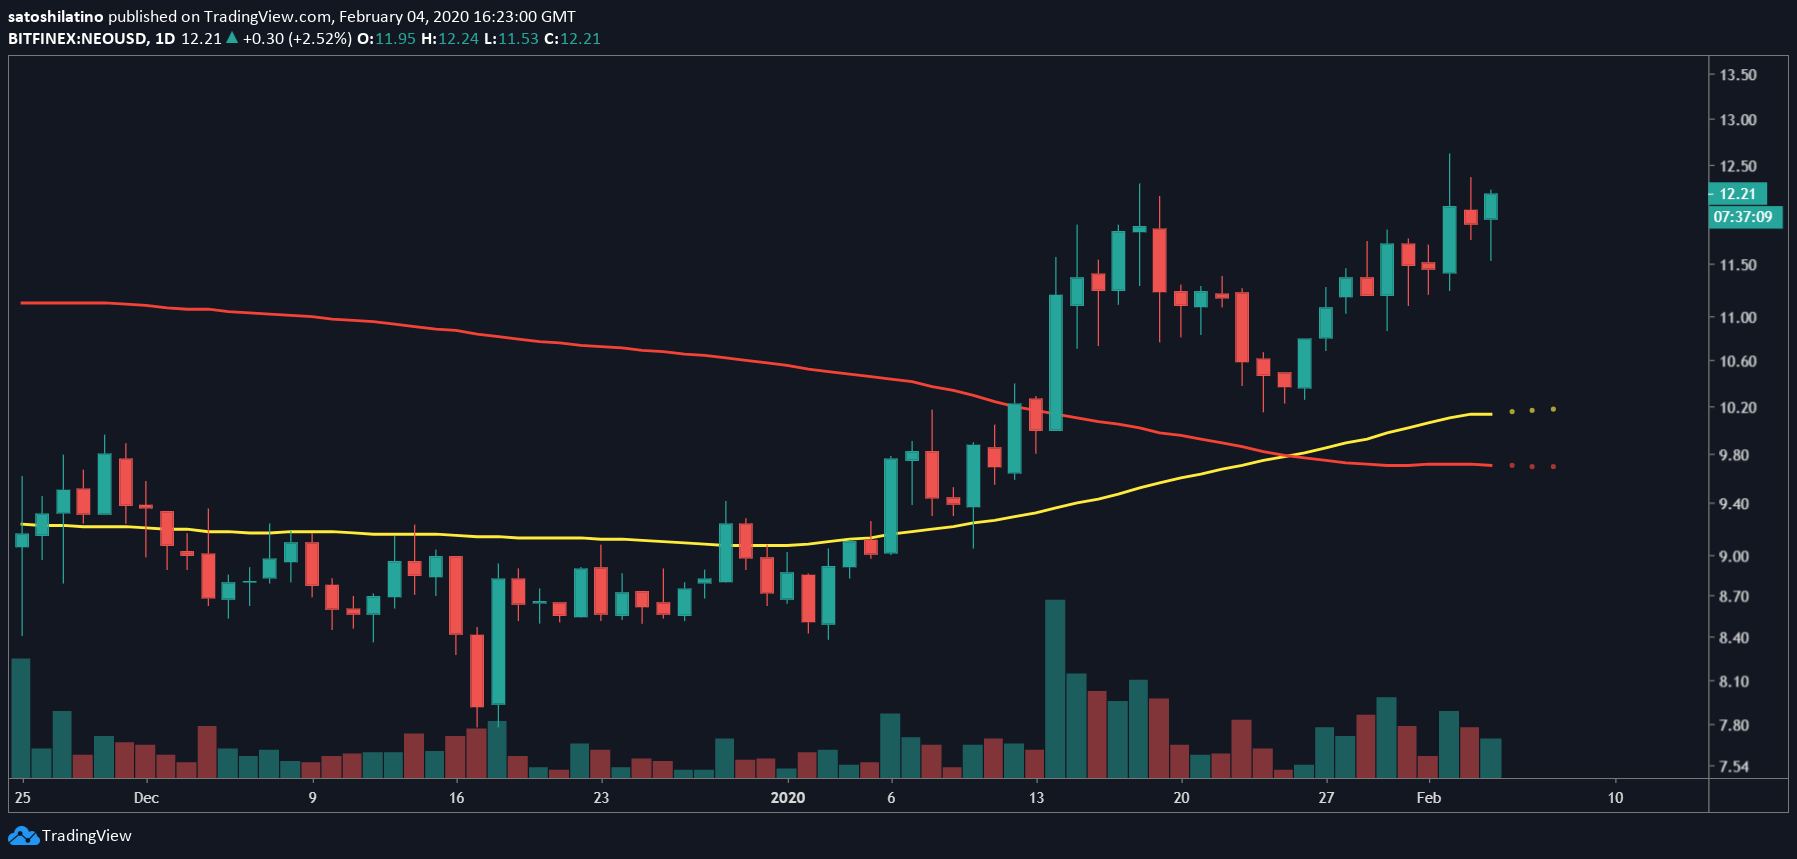
After surging over 60% for the past 49 days, NEO reached a significant price hurdle. This resistance level is represented by the setup trendline based on the 1-day chart. Additionally, the TD sequential sequential indicator is on a green nine candlestick, which is a sell signal.
A spike in the selling pressure behind this crypto around the current price levels could validate the bearish formation. If this happens, then NEO could be bound for a one to four candlestick retracement.
Regardless of the bearish signal presented by the TD sequential indicator, NEO looks very bullish.
A golden cross formed on Jan. 25, which is a positive sign. This technical pattern developed as the 100-day moving average crossed above the 200-day moving average. Some of the most prominent technical analysts in the industry see this pattern as one of the most definitive buy signals that could start a bull market.
The last time NEO experienced a golden cross between its 100 and 200-day MA was on May 14, 2019. Following the moving average crossover, this cryptocurrency skyrocketed 116%. It went from trading at a low of $9.7 to a high of $21 over a span of just one month.
Moreover, a cup and handle appears to be developing within the same time frame. This is considered a bullish continuation pattern that could present a buying opportunity upon the break of the $12.4 resistance level.
By measuring the distance between the bottom of the cup and the breakout point, a target of 37% is given by this pattern. If validated, NEO could climb up to $17.
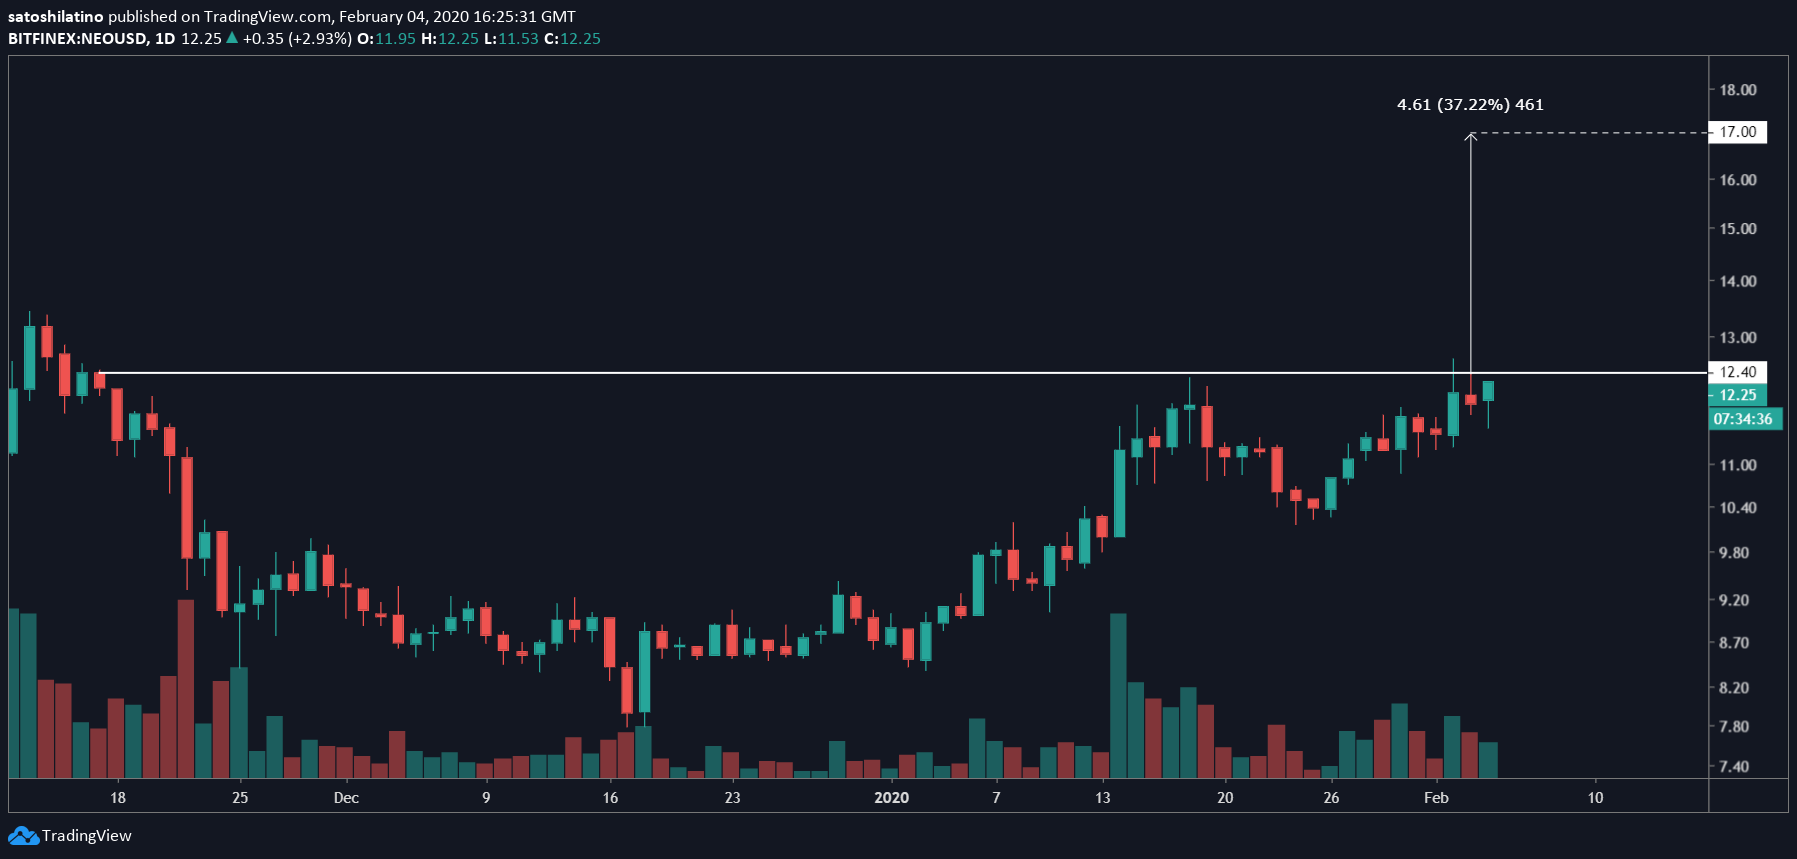
On its way up, NEO could find resistance around $14, $14.65, and $15.62. However, if the sell signal presented by the TD sequential indicator is validated, this cryptocurrency could plunge to $10.80 or $10.20 before it continues its bullish trend.
Moving Forward
The entire cryptocurrency market entered an uptrend since the beginning of the year. Due to the massive gains that most cryptos have posted, including Ethereum, EOS, and NEO, investors appear overwhelmingly bullish. As a result, the Crypto Fear and Greed Index (CFGI) is sensing high levels of greed among market participants since last week.
The last time the CFGI was on a 59 (greed), was in Nov. 03, 2019, when it was at 56. During that time, $73 billion were wiped out of the whole cryptocurrency market. Now, similar bearish patterns can be seen throughout the market, suggesting a correction is coming.