Ethereum Price Analysis: Coming Down
A series of bearish patterns is about to be triggered.

Share this article
- Ethereum has a bearish short-term and medium-term trading outlook
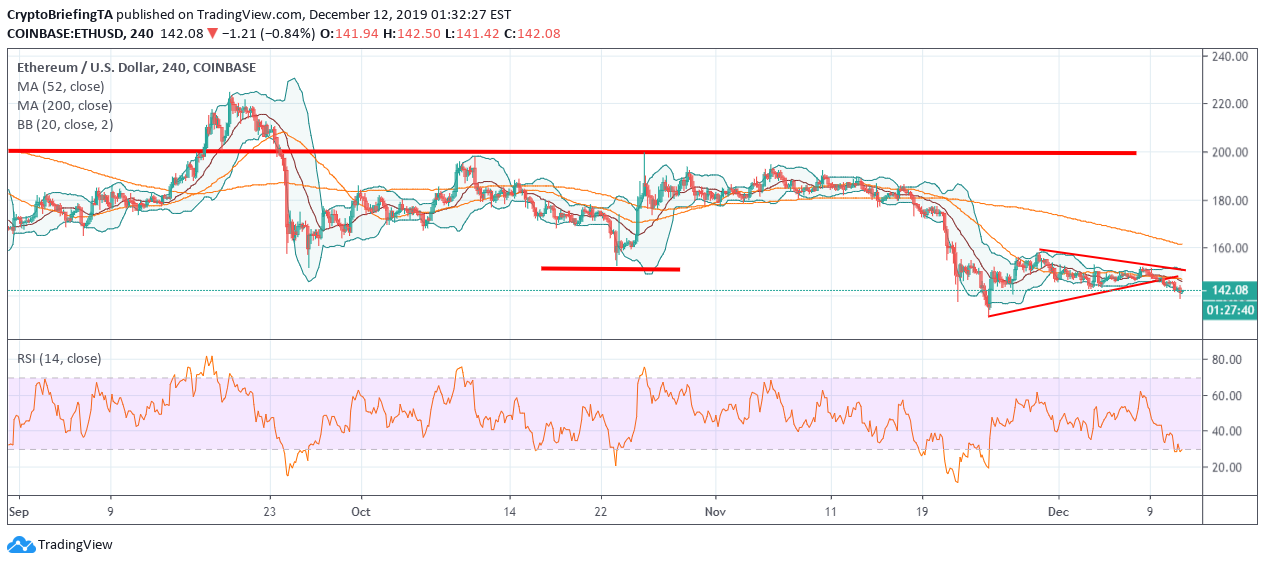
- The four-hour time frame shows that an inverted head and shoulders pattern has been invalidated
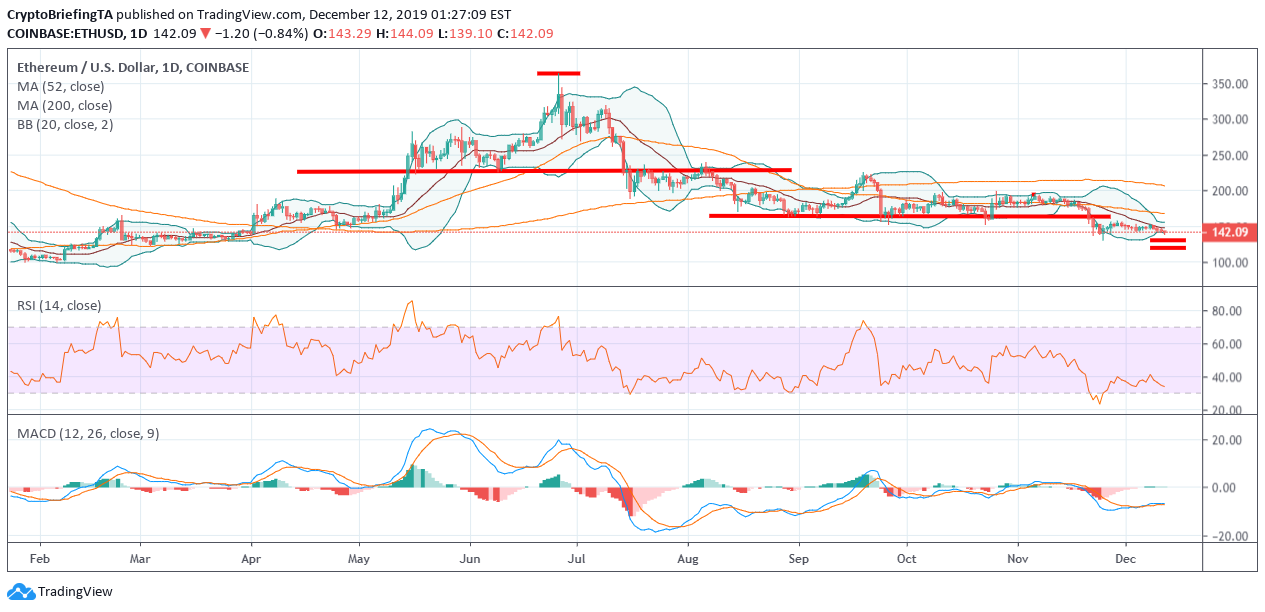
- The daily time frame continues to show a bearish pattern playing out to the downside
Ethereum is coming under increasing technical selling pressure below the $150.00 level, as the second largest cryptocurrency continues to be dragged lower by the market downtrend.
The ETH/USD pair remains vulnerable to further declines over the short-term, with technical analysis suggesting that sellers may soon attempt to break the November swing-low.
The four-hour time frame shows that a large inverted head and shoulders pattern has been invalidated, with the overall downside target of the bearish invalidation located around the $100.00 level.
A break under the $135.00 support should heighten technical selling in the ETH/USD pair, placing the psychological $100.00 level firmly in focus.
Furthermore, a bearish triangle pattern breakout is also in play across the lower time. Bitcoin is also suffering from a similar fate, after breaking under a triangle pattern on the lower time frames.
The daily time frame is equally as bearish and continues to depict a series of large head and shoulders pattern playing out to the downside, with $125.00 as the target of the first bearish pattern.
At current trading levels, buyers would need to move the price above $178.00 to change the short-term negative outlook. A move above the $220.00 level is needed to change the medium-term negative bias.
The Relative Strength Index has yet to reach oversold levels over the medium-term and continues to issue a strong sell signal on both the daily and weekly time frame.
Upside Potential
The four-hour time frame shows that key technical resistance is now located at the $150.00 and $160.00 levels.
Key technical resistance over the medium-term is located at the $178.00 and $198.00 levels.
Downside Potential
The four-hour time frame is showing that the ETH/USD pair has strong medium-term technical support around the $135.00 and $125.00 levels.
Critical long-term technical support for Ethereum is located at the $100.00 support level.
Summary
Technical analysis suggests that the ETH/USD pair could see further double-digit declines if the $135.00 level is broken.
Both the four-hour and daily time frames are showing that the $100.00 level remains a possible bearish target.
Check out our introductory guide to Ethereum.
Share this article
