
Ethereum Price Analysis ETH / USD: In Dire Straits
ETH is under heavy selling pressure.
- Ethereum has a bearish short-term and medium-term trading outlook
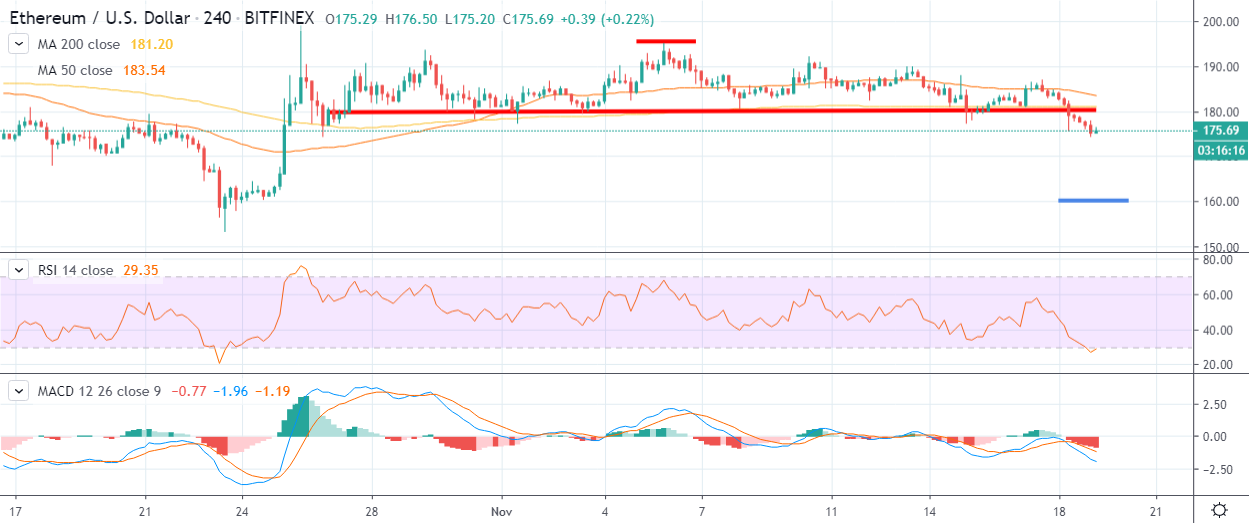
- The four-hour time frame shows that a head and shoulders pattern has been triggered
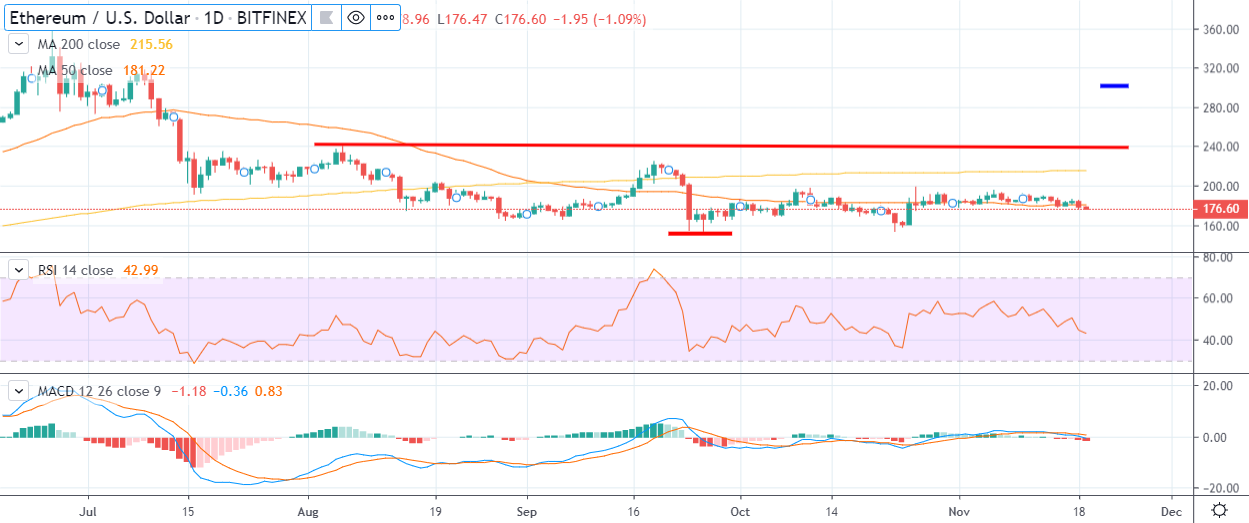
- The daily time frame shows that a bullish inverted head and shoulders pattern remains in play
The decline in the broader cryptocurrency market has placed Ethereum in a vulnerable technical position, with the ETH / USD pair moving below critical technical support.
Ethereum had been struggling to rally away from the important $180 support level, after sharply reversing from the $195 resistance level earlier this month.
At current trading levels, Ethereum is trading lower by around 3.5 percent on a monthly basis, however, the ETH / USD pair still trades around 35 percent higher since the start of the year.
The $180 level is the neckline of a bearish head and shoulders pattern, that has a downside projection that could take the ETH / USD pair towards the $160 support level.
Short-term technical indicators are also extremely bearish for the ETH / USD pair, with the MACD indicator on the four-hour time frame signaling further losses ahead.
The daily time frame shows that a bullish inverted head and shoulders pattern is still valid, despite the recent decline. Going forward, buyers must continue to defend the $160 level to stop the pattern being invalidated.
It is worth noting that the cryptocurrency has broken below its 50-day moving average, increasing medium-term selling pressure on the cryptocurrency.
According to the latest sentiment data from TheTIE.io, the short-term sentiment towards Ethereum is bearish, at 40.00 %, while the overall long-term sentiment towards the cryptocurrency is also bearish, at 36.00%.
Upside Potential
The four-hour time frame shows that key technical resistance is located at the $180 and $194 level. Buyers need to rally price above the $194 level to invalidate the bearish head and shoulders pattern.
Key technical resistance above the $194 level is found at the $220 and $240 levels.
Downside Potential
The four-hour time frame is showing that the ETH / USD pair has strong short-term technical support around the $175 and $169 levels.
Key medium-term technical support for the ETH / USD pair is located at the $160 and $154 levels.
Summary
Ethereum is back under short and medium-term technical pressure while trading below the important $180 level.
Going forward, buyers need to defend the $160 level to avoid a much deeper decline in the ETH / USD pair.
Check out our introductory guide to Ethereum.