Ethereum Price Analysis ETH / USD: Ravine Fall
ETH is falling from the precipice.

Share this article
- Ethereum’s technicals remain bearish over both the short-term and the medium-term
- The four-hour time is showing a bearish head and shoulder patterns with a $20.00 downside projection
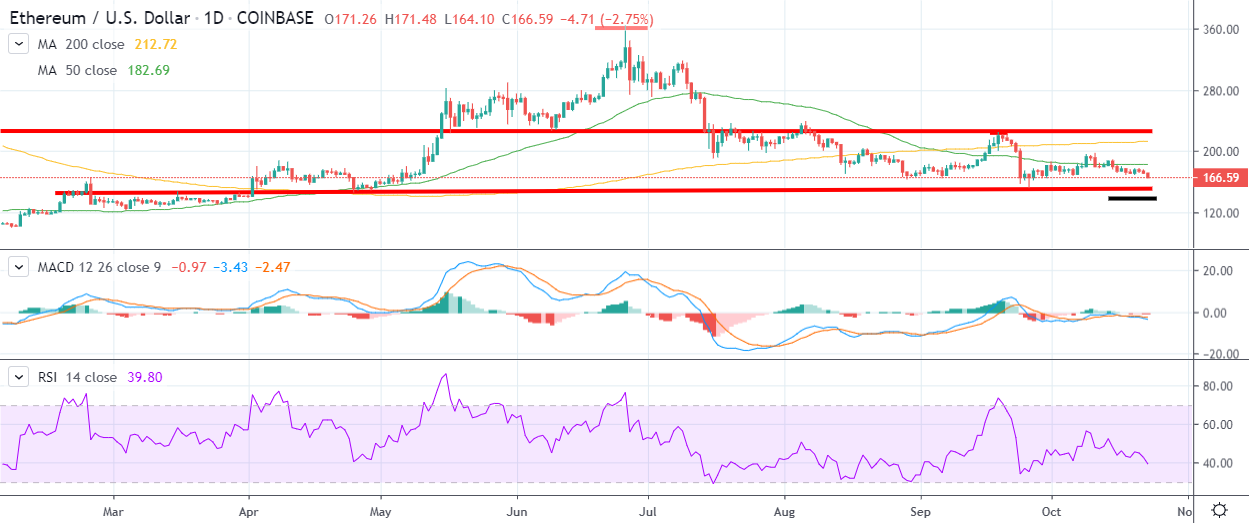
- The daily time frame shows multiple bearish head and shoulders patterns
Ethereum is back under heavy downside pressure after the second-largest cryptocurrency by market capitalization suffered a heavy technical rejection from just below the $200.00 level earlier this month.
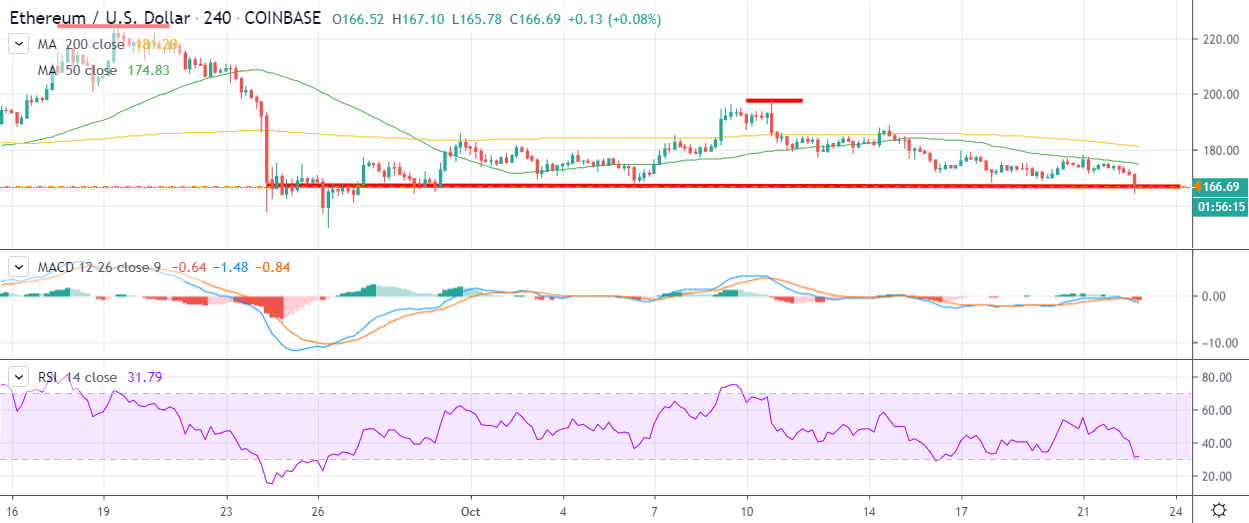
According to short-term technical analysis, the ETH / USD pair is at serious risk of incurring further losses while trading below the important $168.00 support level.
At present, Ethereum is trading around eight percent down on its monthly opening price, while the cryptocurrency has shed around sixteen percent from its monthly price peak.
Going forward, a series of bearish head and patterns appear to be predicting that the ETH / USD pair is likely to experience an upcoming drop towards the $147.00 level.
The four-hour time frame is highlighting that the ETH / USD pair is trading below the neckline of a well-defined head and shoulders pattern with a $20.00 downside projection.
Furthermore, the daily time frame highlights a much larger head and shoulders pattern that’s overall downside projection is also around the $147.00 level.
Traders should be aware that once the $147.00 level is achieved, the ETH / USD pair could experience a sharp rebound as traders book profits. Failure to quickly rally away from the $147.00 level should be considered extremely bearish for the ETH / USD pair over the medium-term.
According to the latest sentiment data from TheTIE.io, the short-term sentiment towards Ethereum is neutral, at 50.00 %, while the overall long-term sentiment towards the cryptocurrency is neutral, at 46.50%.
Upside Potential
The four-hour time frame highlights that the ETH / USD buyers need to move price above the $180.00 resistance level to change its short-term bearish bias.
Ethereum bulls also need to rally price above the $198.00 level to encourage a much stronger medium-term rally. The ETH / USD pair’s weekly pivot point is also a key area to watch, around the $175.00 level.
Downside Potential
The four-hour time frame is currently showing that a bearish head and shoulders pattern has formed, with the $166.00 level the neckline of the bearish pattern.
Both the four-hour and daily time frames are showing the $147.00 level is the likely bearish target if the decline continues. The $125.00 level offers the strongest form of technical support under the $140.00 level.
Summary
Ethereum is back under heavy downside pressure while trading below the technically important $166.00 level.
Warning signs are emerging that the ETH / USD pair could face a much steeper decline towards the $147.00 level according to short and medium-term technical analysis.
Check out our introductory guide to Ethereum.
Share this article
