
Ethereum, XRP, and Litecoin Could See Further Decline
An opportunity to buy the dip on major altcoins?
Last week, the market began to overheat as greed took hold. Ethereum, XRP, and Litecoin saw losses in the subsequent sell-off. Indicators show further declines.
Ether Prepares for Further Drop
Ethereum saw its price skyrocket over 145% in the last two months. This cryptocurrency went from trading at a low of $117 in mid-December 2019 to a recent high of $287. During its run up, Ether encountered a small correction of 12% in mid-January.
This retracement served as an opportunity for sidelined investors to get back into the market, later pushing its price higher. Now, it seems like market participants could be given another chance to buy ETH at a lower price.
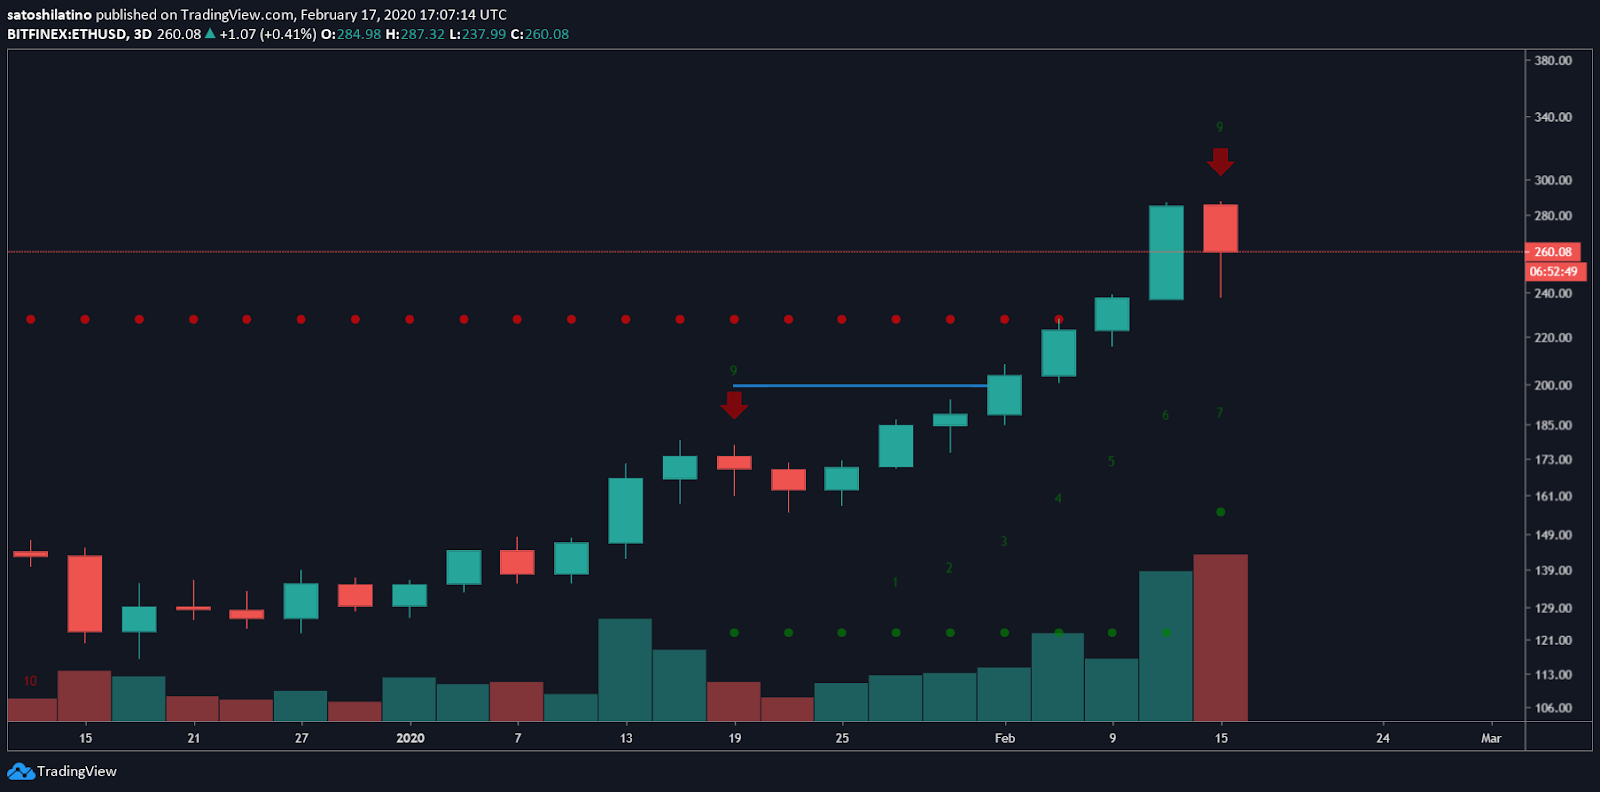
The TD sequential indicator is currently presenting a sell signal in the form of a green nine candlestick on ETH’s 3-day chart. This bearish formation estimates a one to four candlesticks correction before the continuation of the bullish trend. A red two candlestick trading below a preceding red one candle could validate the sell signal given by this technical index.
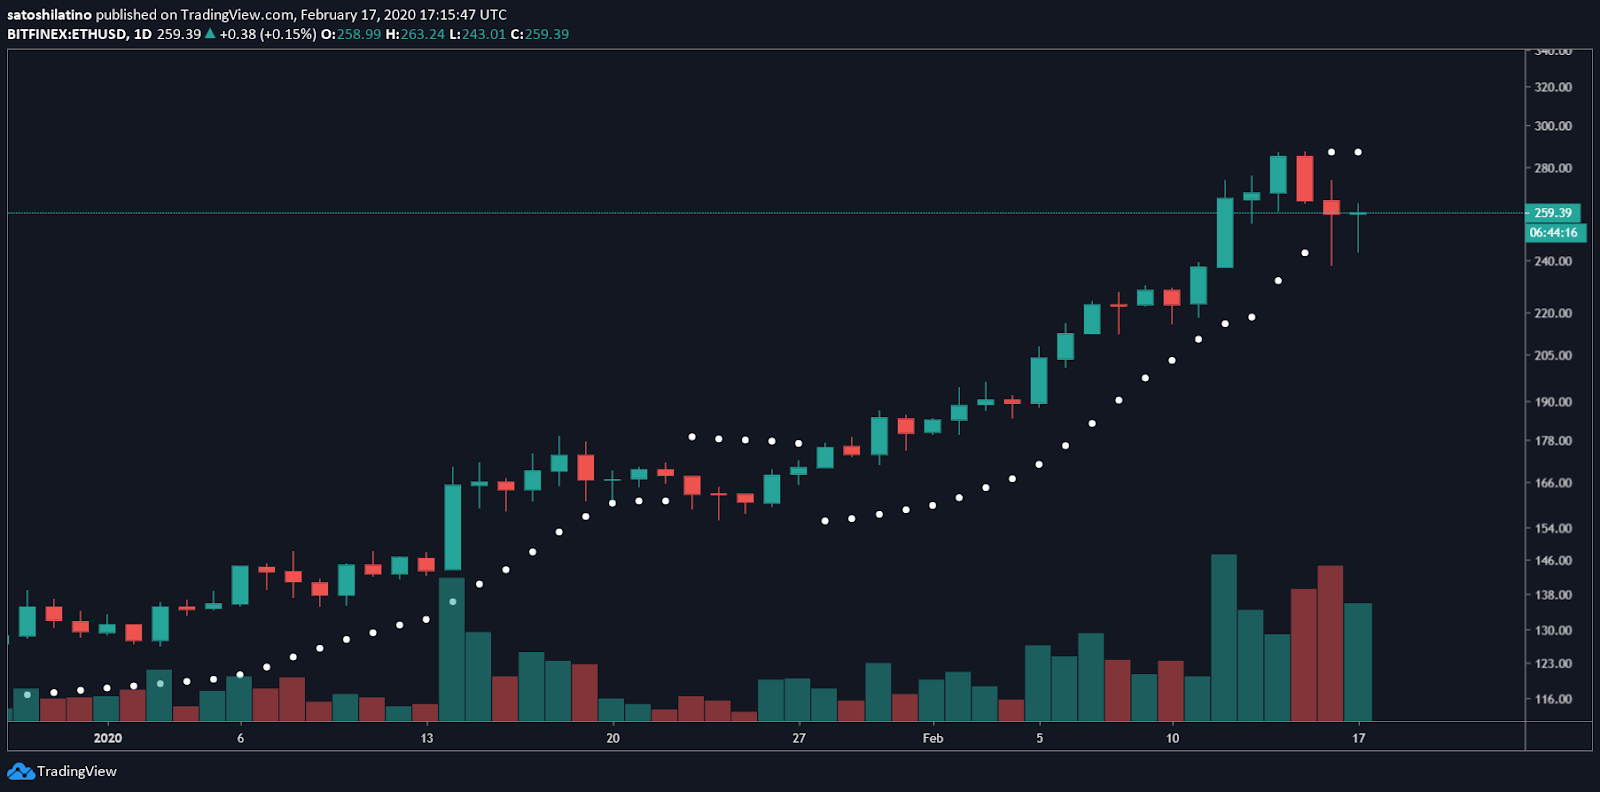
Adding credence to the pessimistic outlook, the parabolic stop and reverse, or “SAR,” recently turned bearish on ETH’s 1-day chart. Each time the stop and reversal points move above the price of an asset, it is considered to be a negative sign. The parabolic SAR flip indicates that the direction of Ether’s trend is changing from bullish to bearish.
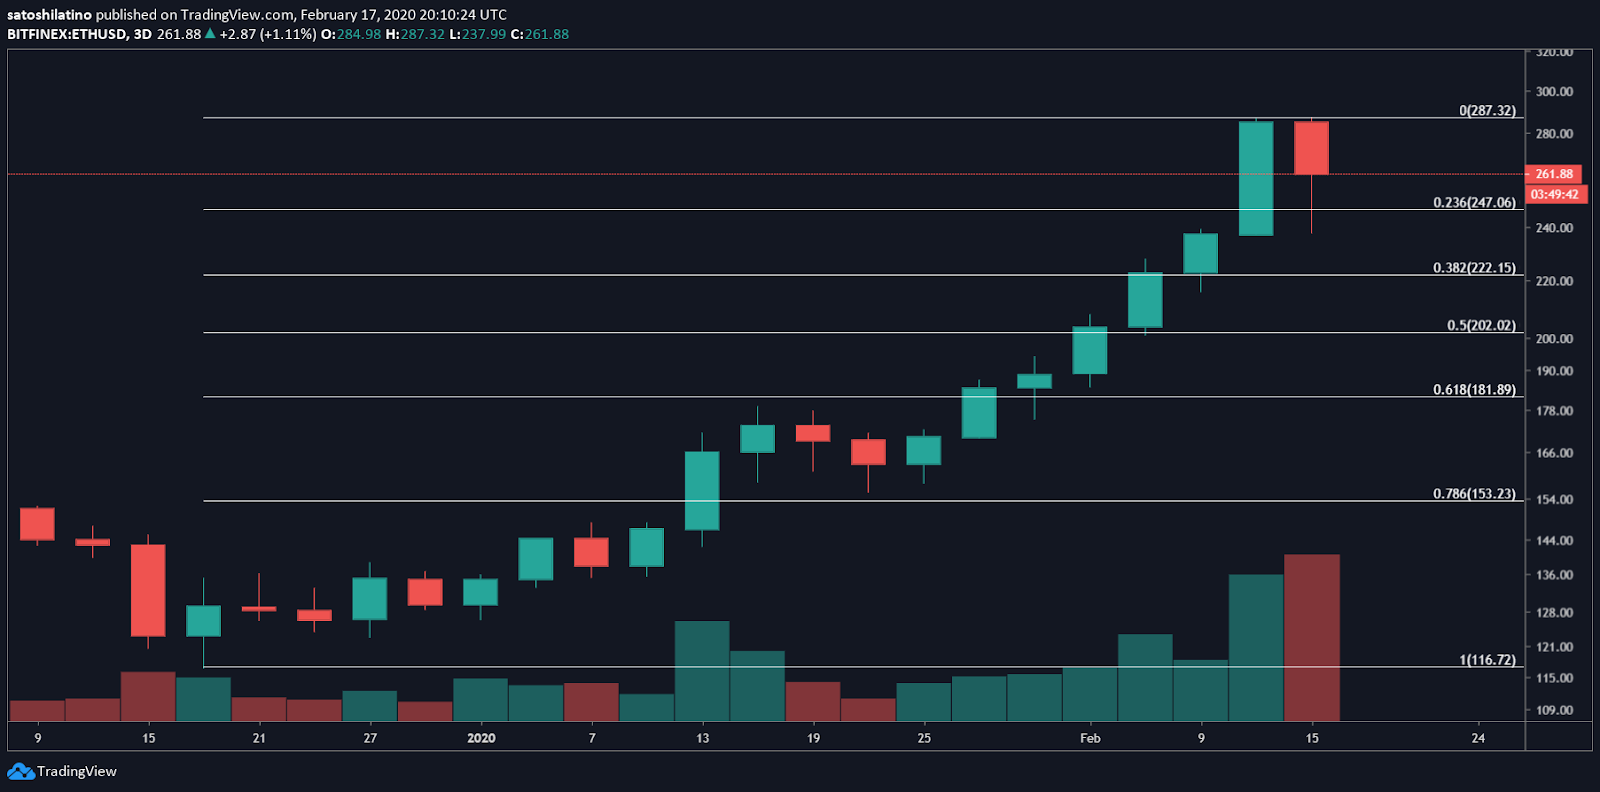
An increase in the selling pressure behind Ether could allow it to break below the 23.6% Fibonacci retracement level, which is providing significant support at the moment. Closing below this hurdle could ignite a further decline to the 38.2%, 50%, or 61.8% Fibonacci retracement level. These barriers of support sit at $222, $202, and $182, respectively.
Even though a steep decline seems likely, the continuation of the uptrend cannot be ignored. According to Sawcruhteez, a renowned technical analyst, Ether could be forming a “big W pattern” from a long-term perspective. This momentum reversal pattern suggests a return to the $800 price level. Under this premise, a correction off the current price levels could be a small price movement in the bigger trend.
XRP Suffers a Major Rejection
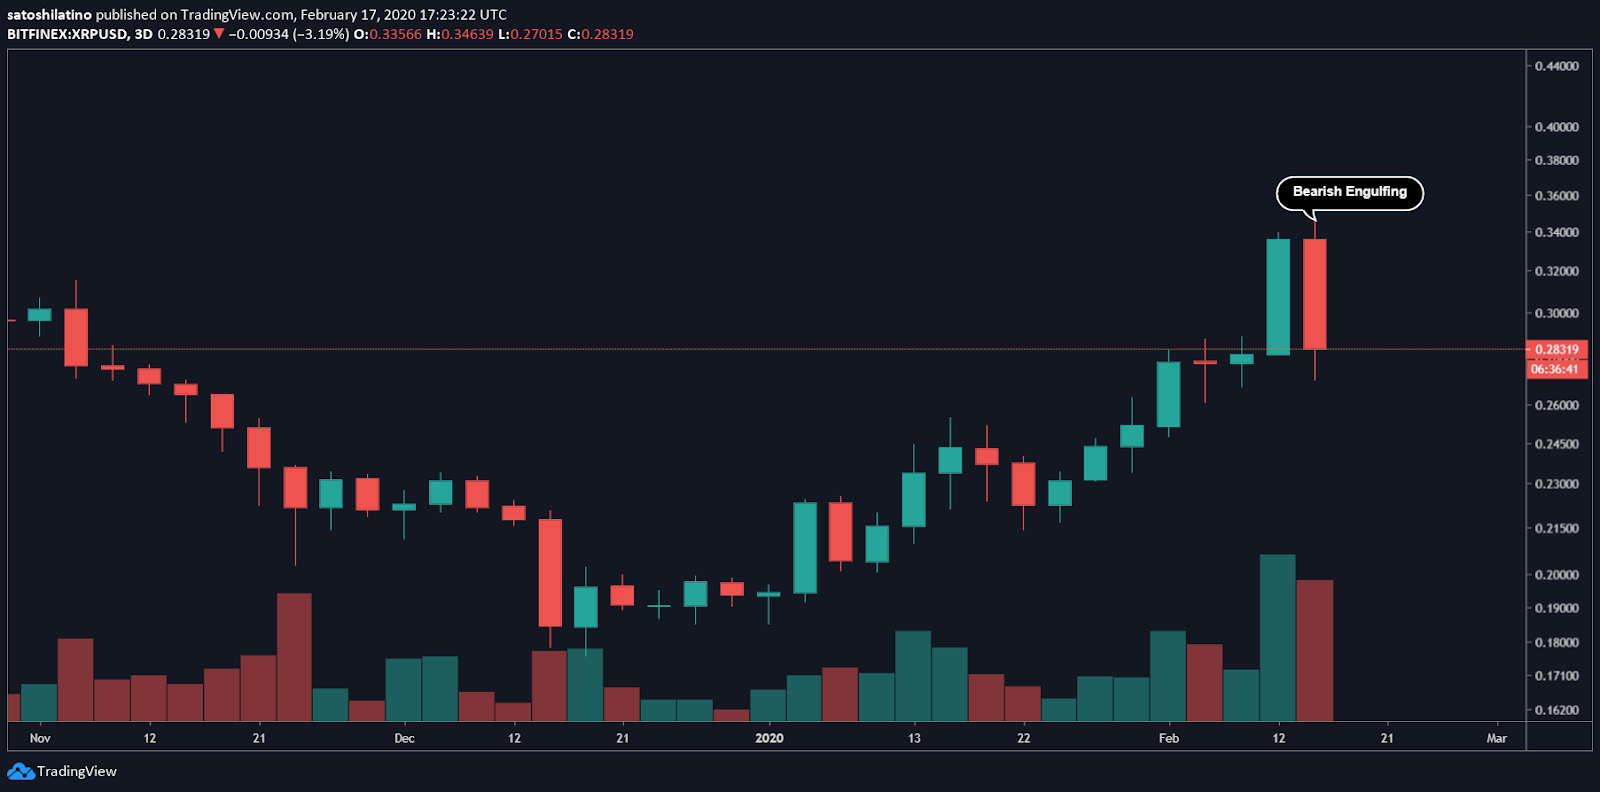
XRP grabbed the attention of many market participants as it moved above $0.34 for the first time since mid-July 2019. However, the 200-three-day moving average rejected this cryptocurrency from advancing further, sending its price down over 20%.
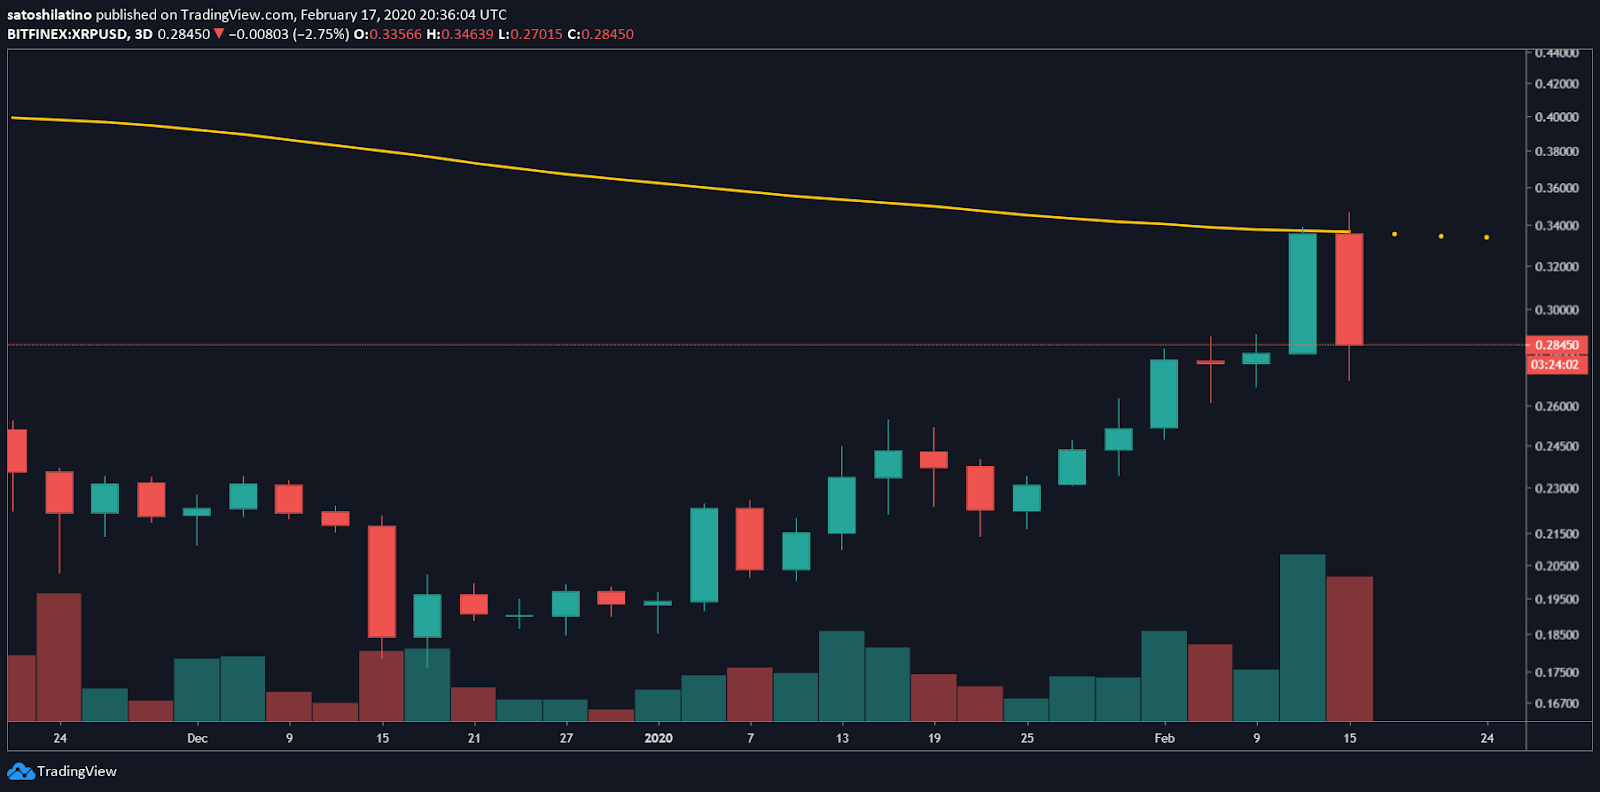
The sudden downturn created a bearish engulfing candle on XRP’s 3-day chart. This is considered a bearish formation that is likely to push the price of XRP further down. Bearish engulfing candles are usually more effective when they are preceded by four or more green candlesticks. However, a red candlestick closing below the engulfing candle will validate the bearish outlook.
If this happens, XRP could plunge to the 61.8% Fibonacci retracement level. On its way down, the 50% Fibonacci retracement level could provide significant support before XRP continues falling.
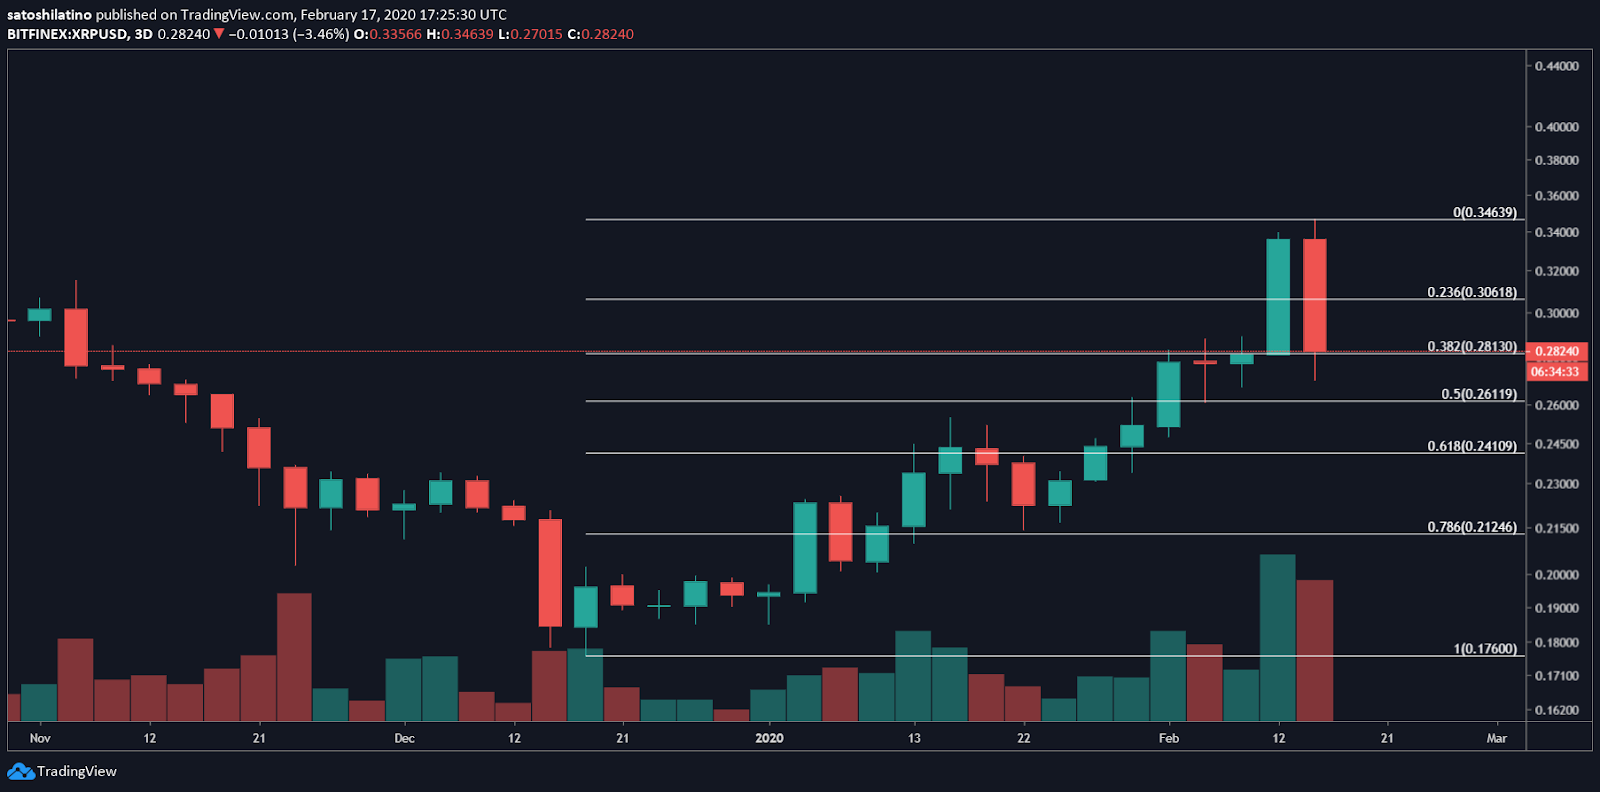
A bullish outlook is contingent on breaking the 200-three-day moving average, especially after the rejection off this level. Closing above it would set the stage for an upswing to the next levels of resistance that sit between $0.39 and $0.45.
Litecoin Shows Signs of Reversal
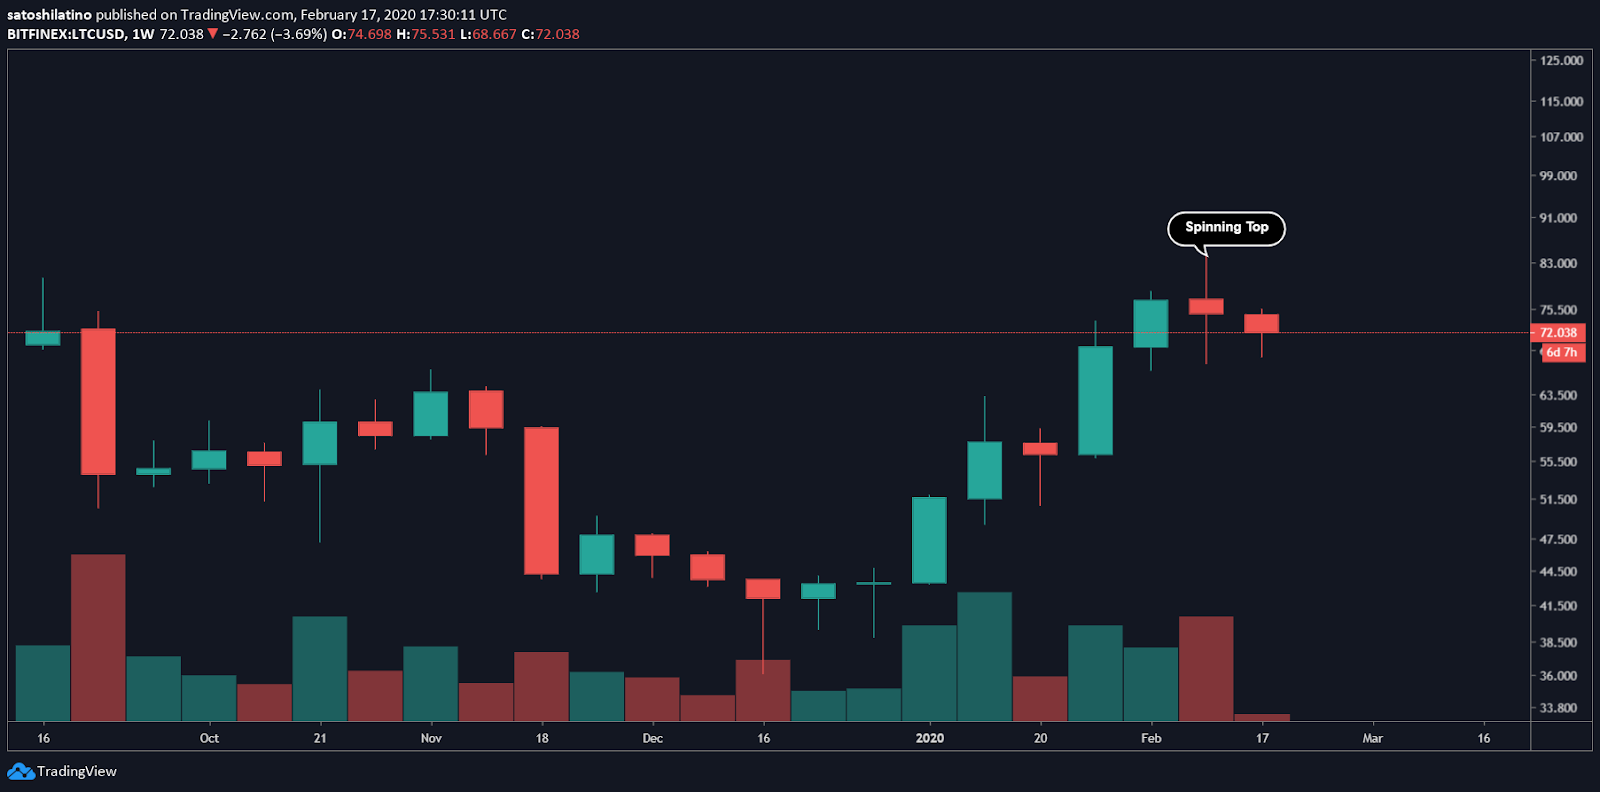
Like Ether, Litecoin shot up substantially since mid-December 2019. Since then, its price went from trading at a low of $36 to a high of $84. Now, a spinning top candlestick seems to have formed on LTC’s 1-week chart.
This technical formation represents indecision about the future direction of Litecoin. Last week, neither the bulls nor the bears were able to gain control of the price action. However, since the current candlestick is a red candle trading below the spinning top candlestick, the probabilities of a correction increase.
Moreover, the TD sequential indicator also forecasts a retracement. This technical index is currently giving a sell signal in the form of a green nine candle that transitioned into a red one candlestick. A red two candlestick trading below the current red one candle could validate the bearish outlook, sending LTC further down.
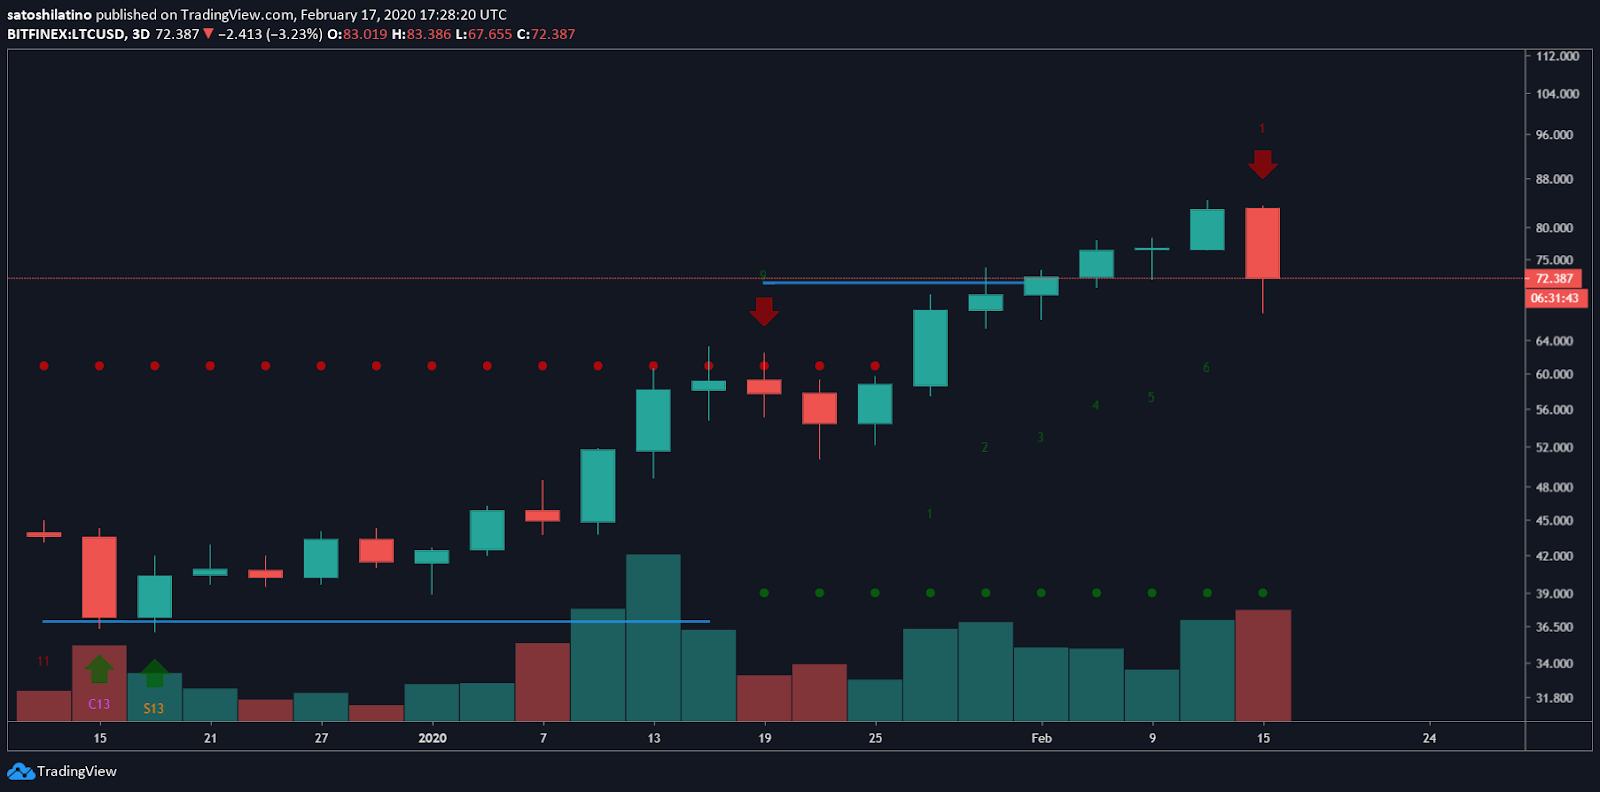
If the 23.6% Fibonacci retracement level fails to hold, LTC could drop to the next level of support around $66. Breaking below this price hurdle could trigger a major sell-off pushing the price of Litecoin to the 50% or 61.8% Fibonacci retracement level. These levels of support sit at $60 and $54.50, respectively.
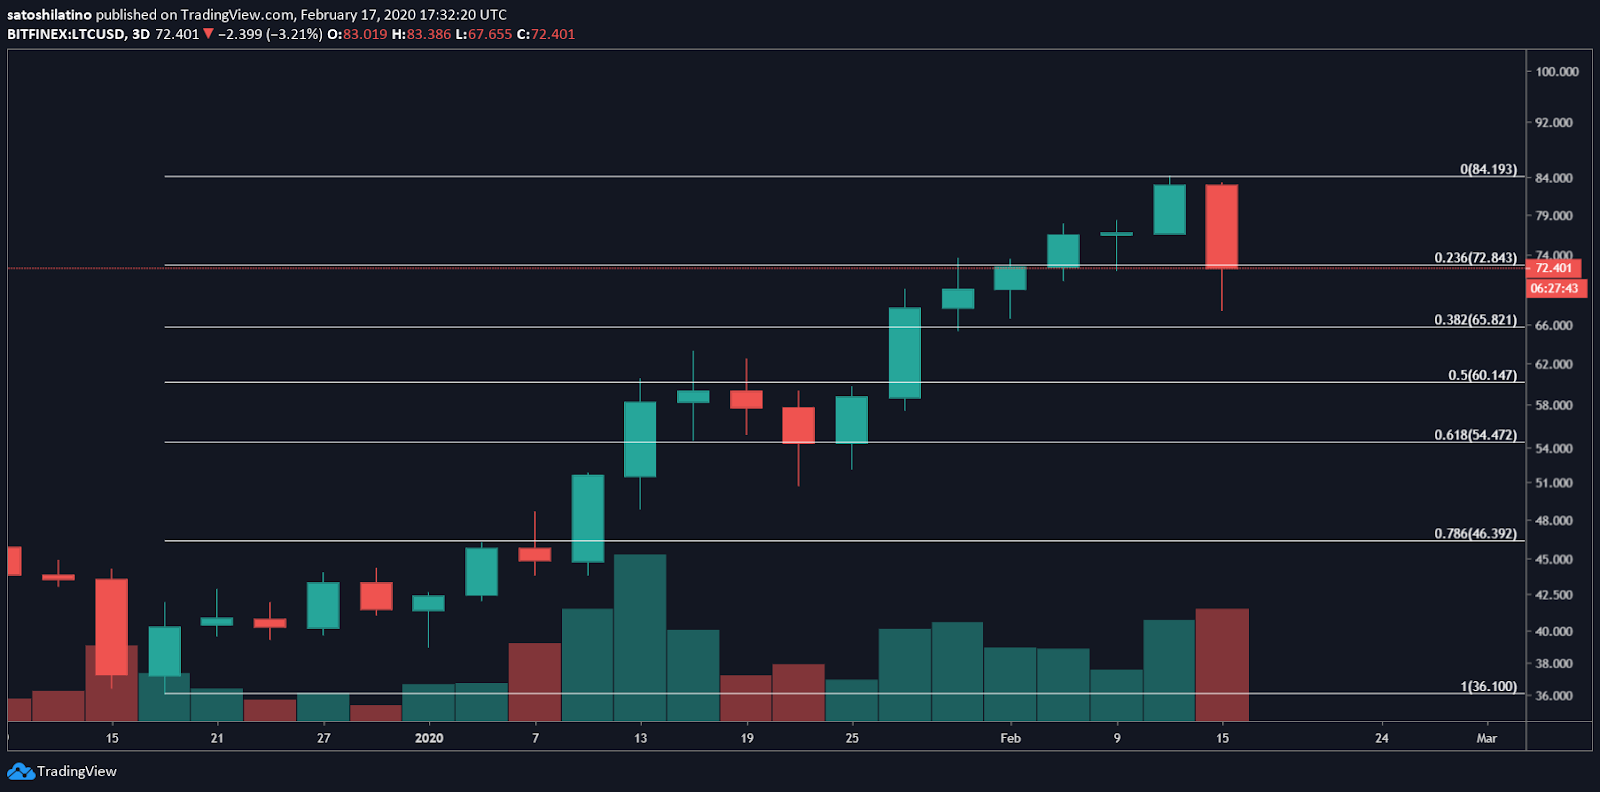
While Litecoin continues trading between $73 and $84, this trading range is a reasonable no-trade zone. Closing below this area would likely validate the bearish pessimistic outlook previously mentioned. However, a spike in demand that sends LTC above $84 could ignite a further advance to $100.
Overall Sentiment
Over $40 billion was erased from the cryptocurrency markets since Feb. 14, in-line with a correction visible throughout most digital assets including Ethereum, XRP, and Litecoin. During that time, the Crypto Fear and Greed Index (CFGI) sensed market participants becoming overwhelmingly bullish. This fundamental indicator reached a value of 65, which represents greed.
Greed is usually perceived as a negative sign. In fact, the last time the CFGI was this high the total crypto market cap dropped 25%. Now, a similar scenario appears to be taking place, but sidelined investors could seize on this opportunity and re-enter the market.