
Ethereum, XRP, and Litecoin Seem Ready for Lift-Off
Three of the big coins are regaining ground, with different metrics pointing toward a bullish impulse. Here are the technicals and on-chain metrics that support that conclusion.
Following a steep downturn in the crypto market, Ethereum, XRP, and Litecoin appear to be regaining some of the losses incurred over the past month. Different technical indexes and on-chain metrics project that a bullish impulse is underway.
Ethereum Bounces Off Strong Support
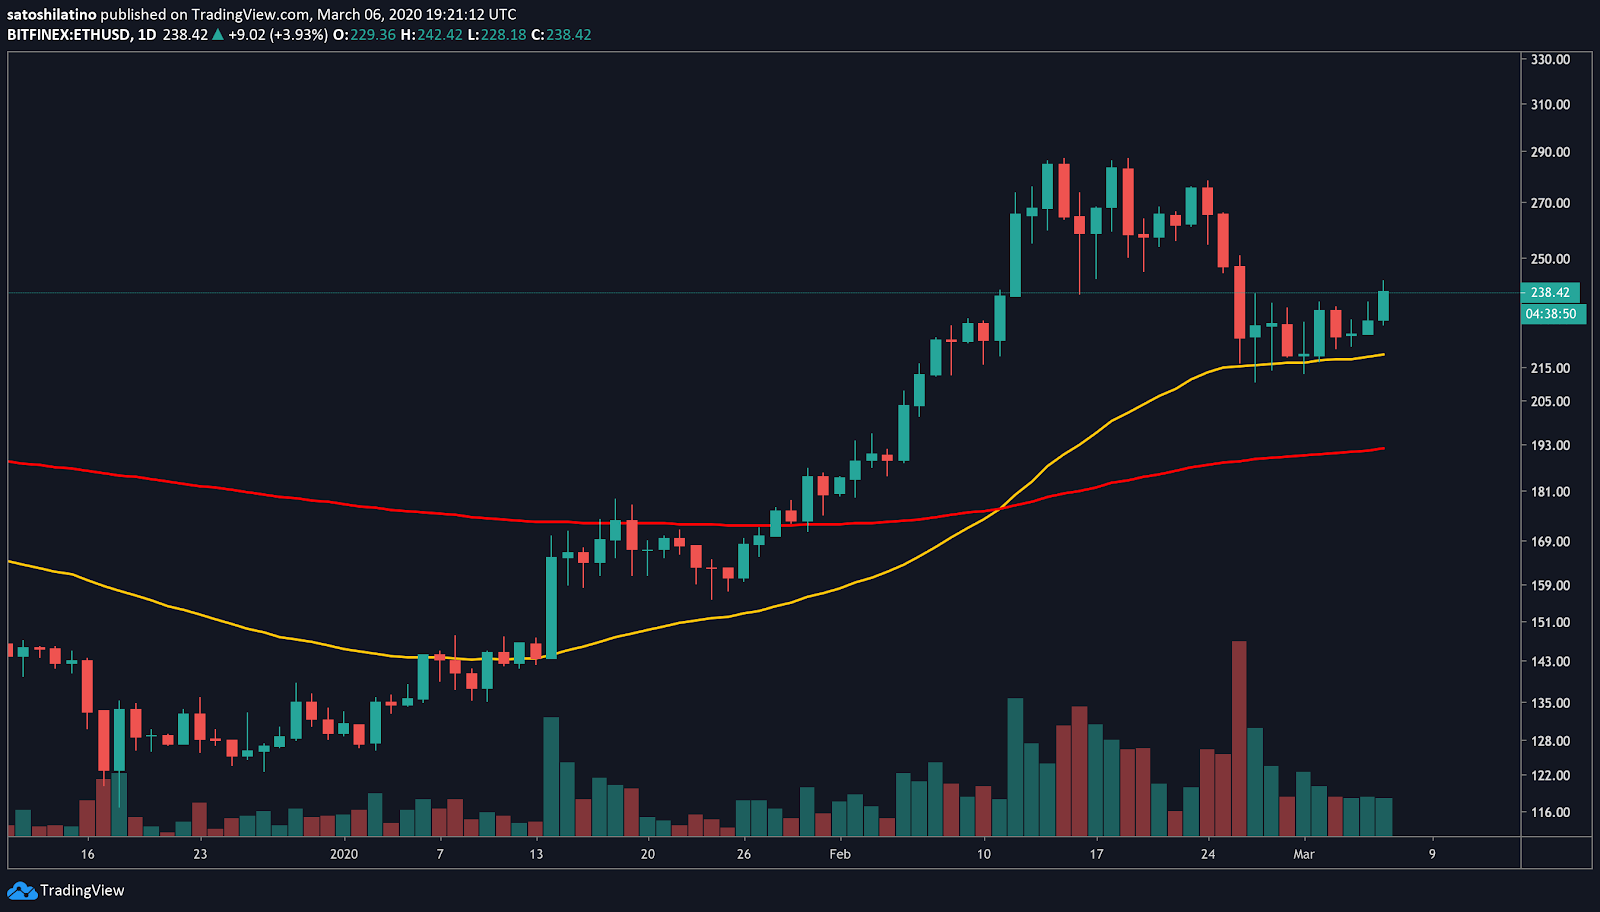
Following a substantial bull rally that saw ETH prices surge over 146%, Ethereum reached an exhaustion point on the 15th of last month. Since then, the smart contracts giant took a 27% nosedive that allowed it to test its 50-day exponential moving average for support.
Thus far, it seems like this EMA will prevent Ether from a further decline. The drop bounced off this significant support level, with the price surging 15% in the past few days.
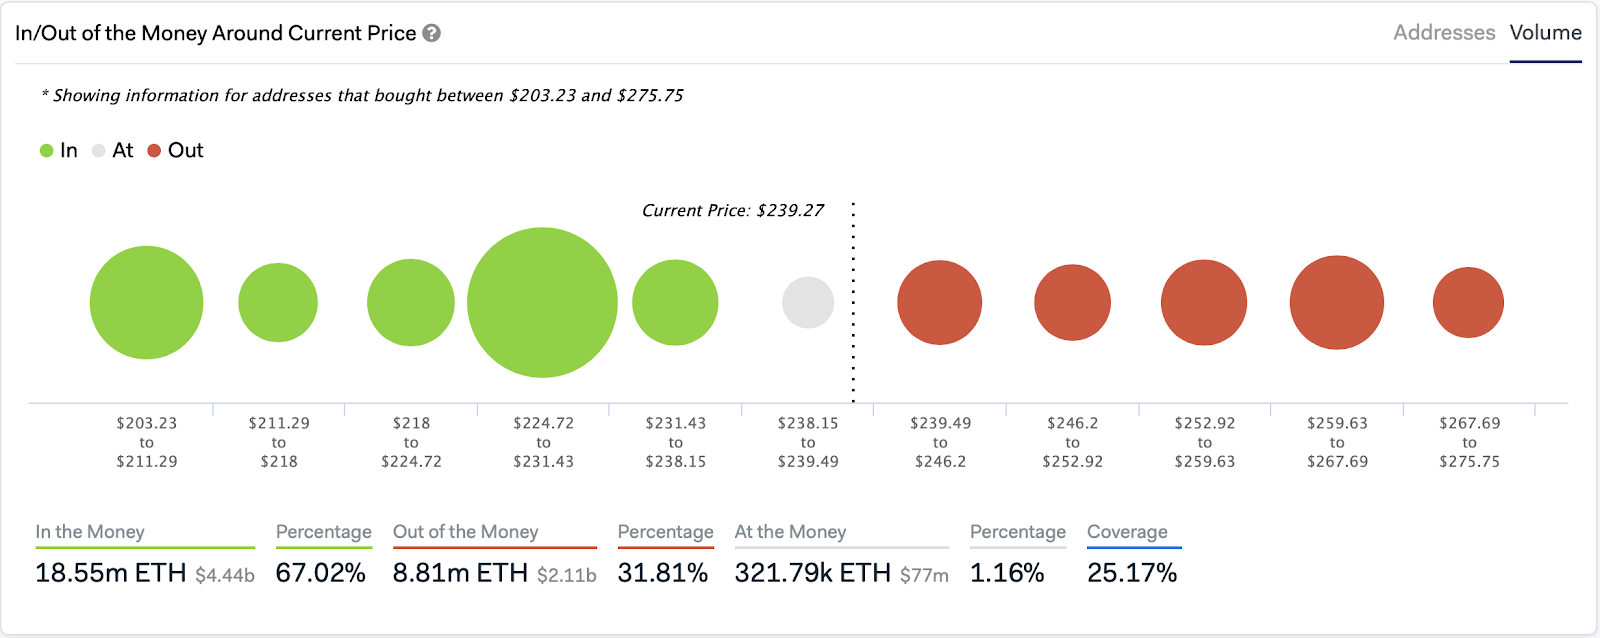
Based on IntoTheBlock’s “In-Out of the Money Around Current Price” (IOMAP) model, the rejection off the 50-day EMA seems to have been triggered by over 1.1 million addresses collectively holding more than 4.2 million ETH between $203 and $211.
While this major support barrier was able to hold, the buying pressure behind Ethereum increased substantially. In fact, the IOMAP reveals that over 881,000 addresses bought more than 8.8 million ETH between $225 and $232.
Now, the large supply around this area could serve as a hurdle in the event of a correction from current prices.
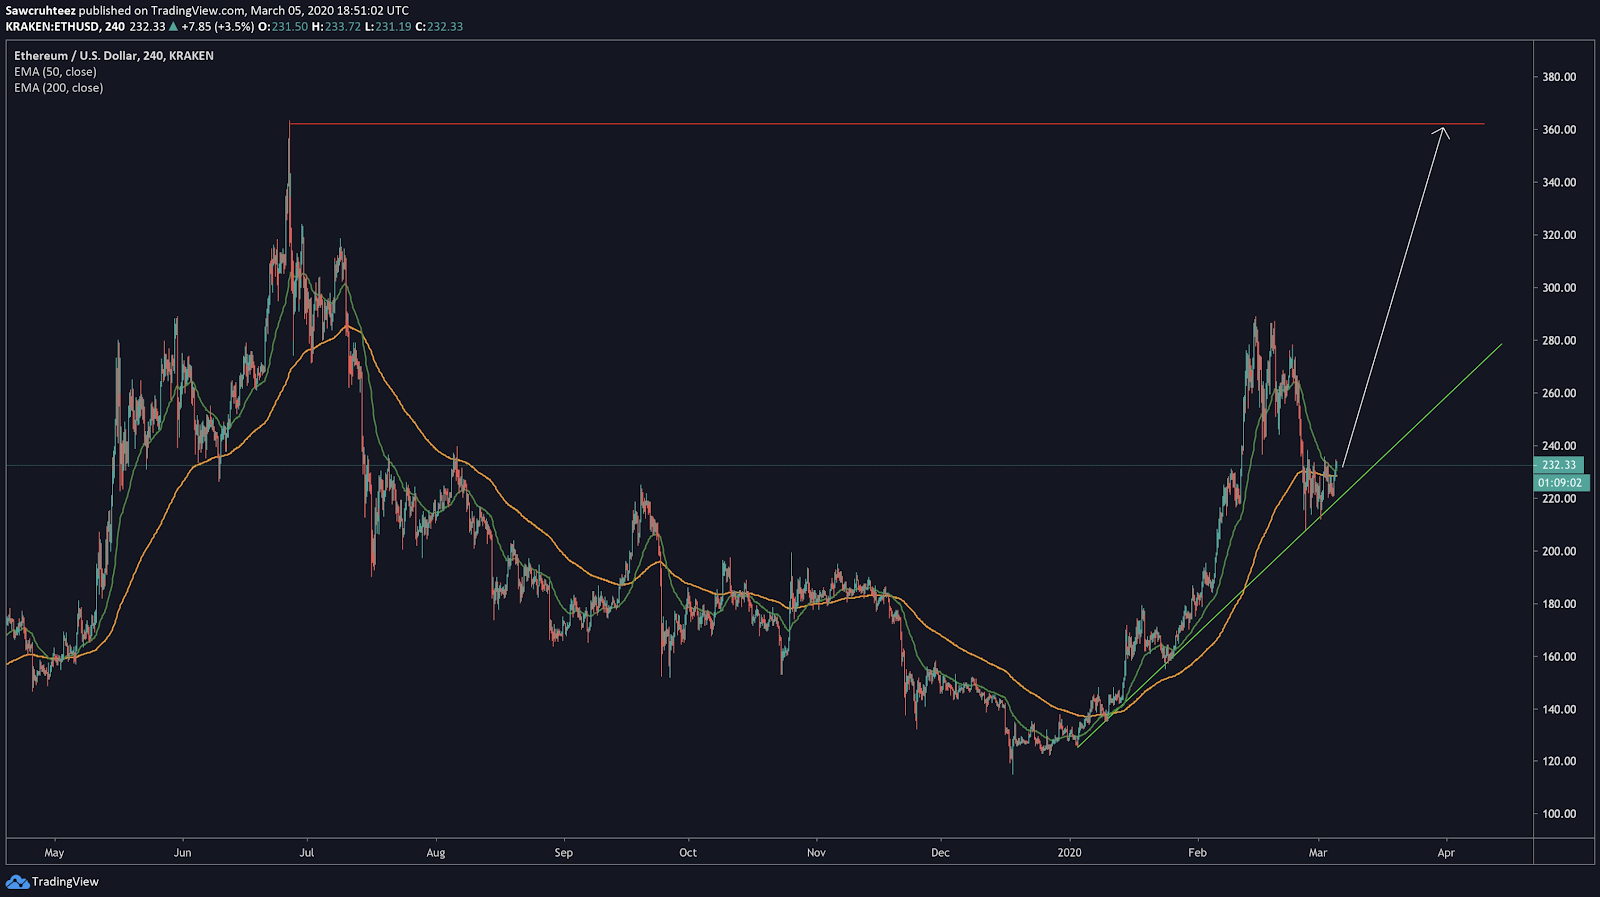
Derivatives trader Sawcruhteez maintains that if the $232 support level continues to hold, Ether could resume the bullish trend it has seen since mid-December 2019. Upon the continuation of the uptrend, ETH may test the July 2019 high of $363. Such a bullish impulse would nearly represent a 50% upswing from current price levels, said Sawcruhteez.
On its way up, Ether could find resistance around the 23.6% Fibonacci retracement level that currently sits at $246. IntoTheBlock’s IOMAP model shows that around this price level, there are over 492,000 addresses holding 1.3 million ETH. That could make it harder for the bulls to break through.
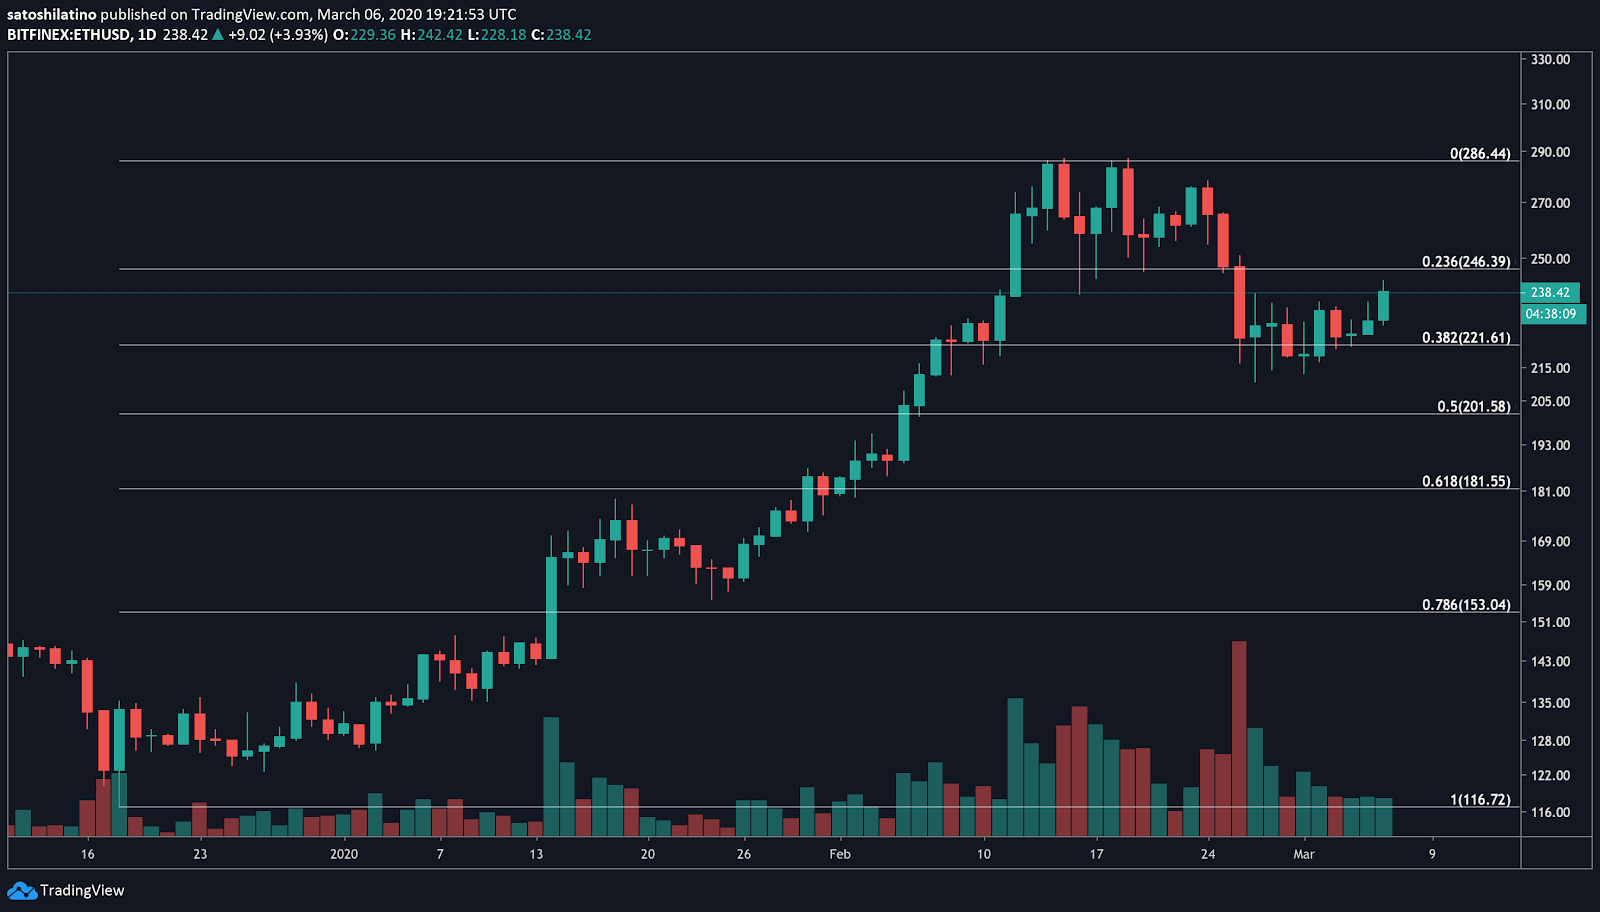
Nevertheless, a spike in demand that allows Ethereum to break through the $246 resistance level could add credence to the bullish outlook presented by Sawcruhteez. If this happens, the next levels of resistance to watch out for sit at $286, $332, and $356.
XRP Trades Within a Pivotal Range
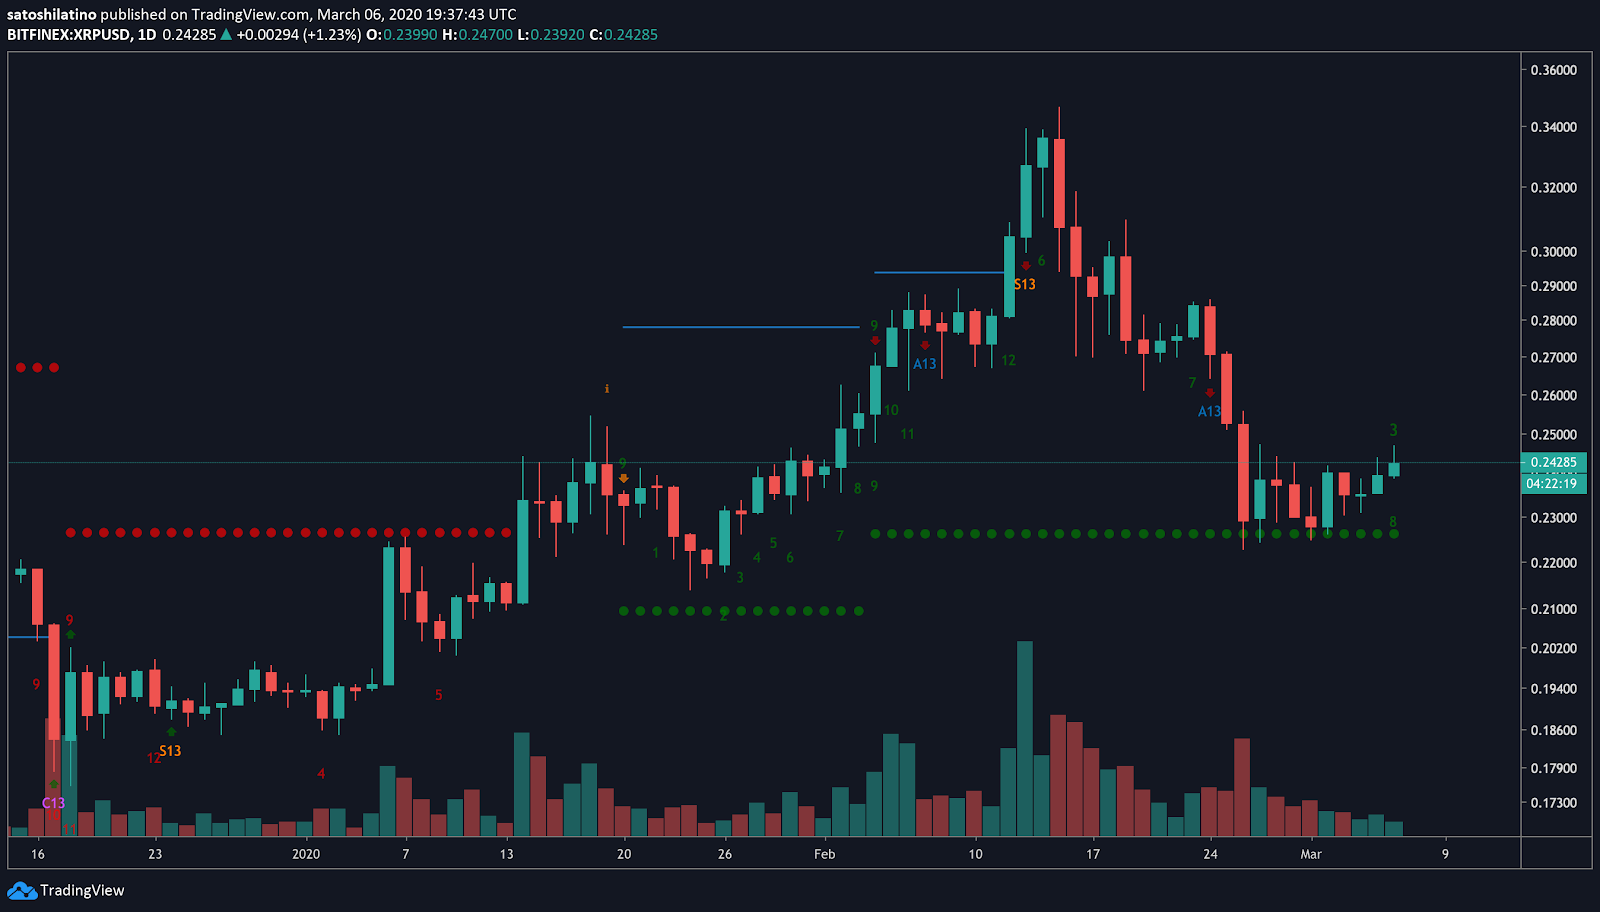
45-years trading veteran Peter Brandt forecasted that XRP was bound for a steeper correction on Feb. 20. Although the technical analyst was expecting a retracement that would take this cryptocurrency to $0.21, it seems like the setup trendline presented by the TD sequential indicator was able to hold.
As a matter of fact, throughout the last two weeks this support barrier has been tested four different times, preventing XRP from a further drop.
Additionally, the 100-day moving average sits very close to the setup trendline, providing an extra layer of support. This support cluster has historically contained the price of XRP, making it a major barrier.
Therefore, breaking below the level could trigger fear among investors, who may panic sell in response, further pushing the price down.
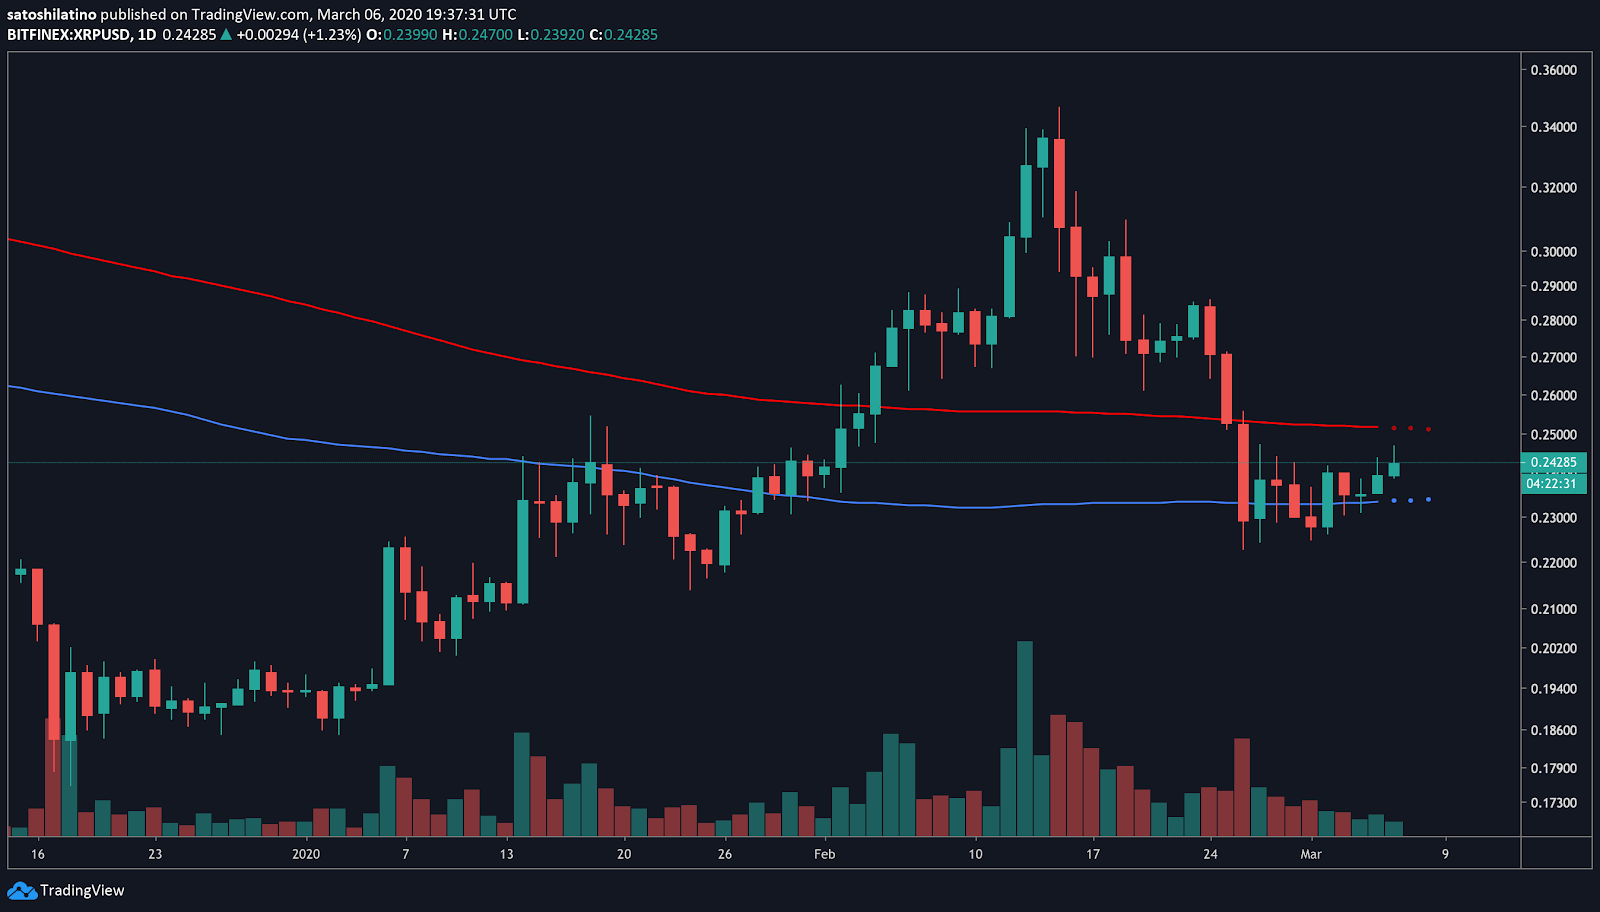
Nonetheless, the 200-day MA may also be able to provide significant resistance if XRP moves upward. Although the strength of this moving average has yet to be tested, the range between the 100 and 200-day MA is a reasonable no-trade zone. Breaking above or below this area will determine where this cryptocurrency is headed next.
Litecoin Sits at a Make-or-Break Point
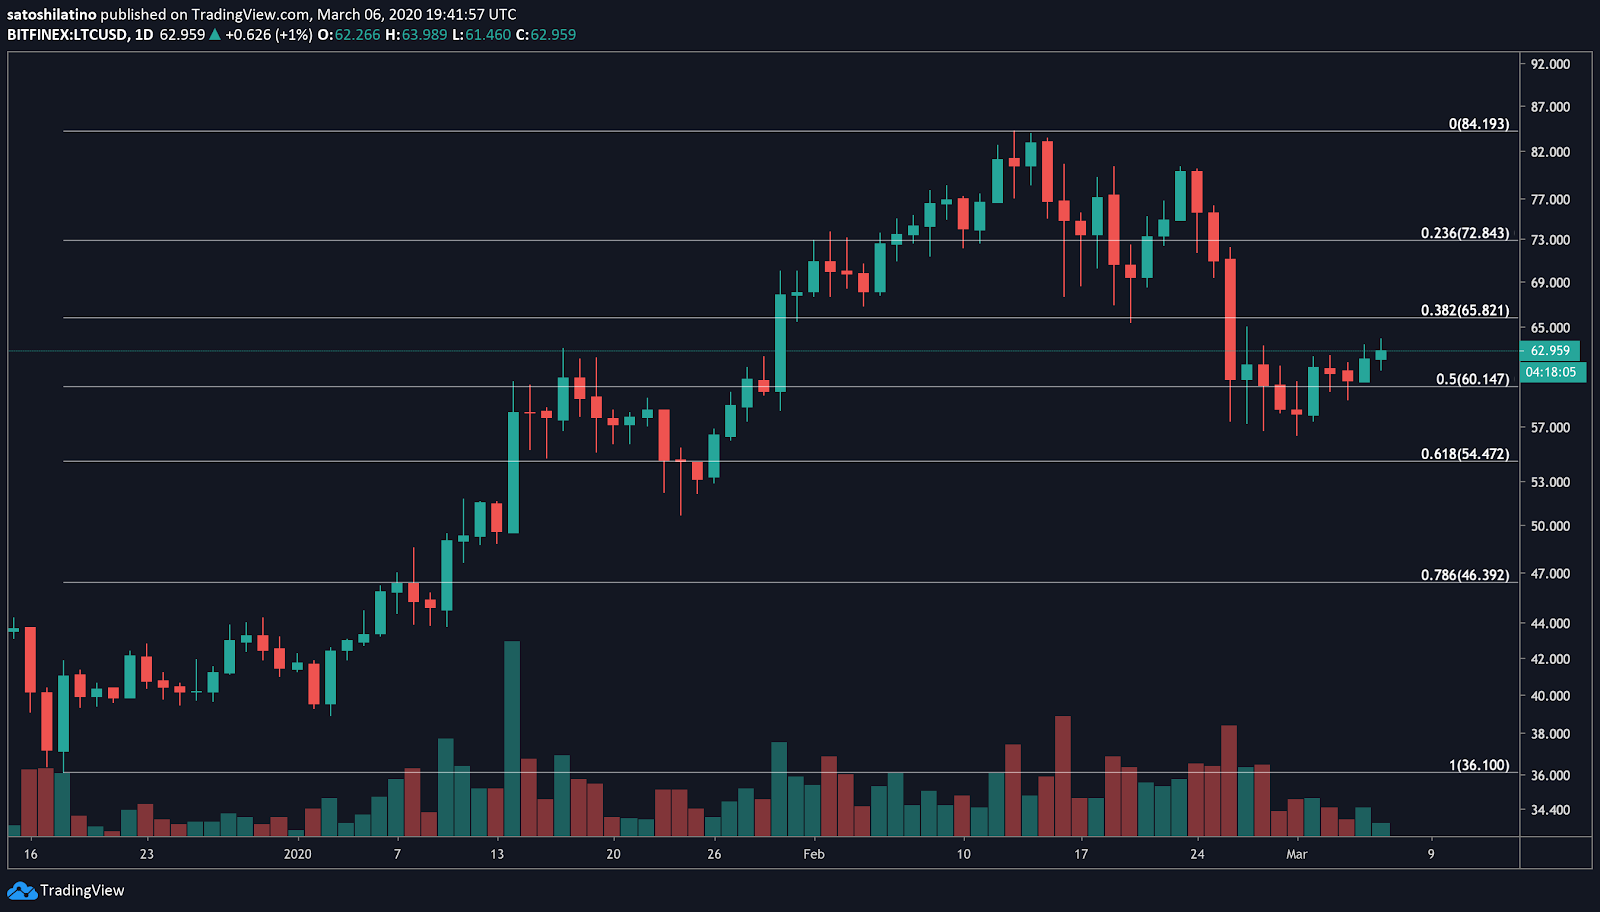
Litecoin heavily benefited from the industry-wide bull run from the start of the year. This cryptocurrency saw its price appreciate over 116% since then. However, on Feb. 13 it appears to have reached a market top.
Reaching this exhaustion point ignited an increase in the selling pressure behind LTC, causing it to drop over 33%. The significant bearish impulse allowed it to hit the 50% Fibonacci retracement level.
Based on Gann’s 50% retracement theory, this Fibonacci level presents a crucial opportunity to “buy the dip.” If Litecoin is able to bounce off this area with enough volume behind it, it could surge and surpass recent yearly highs.
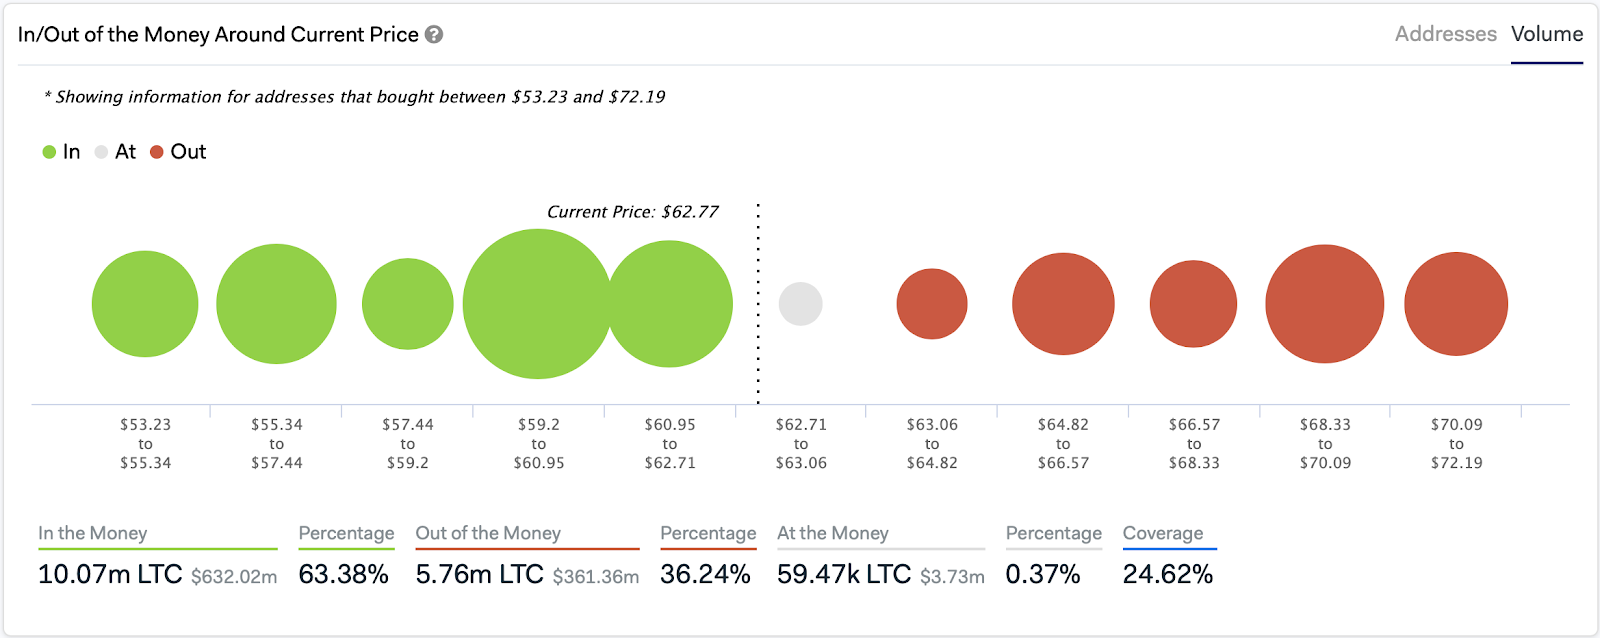
According to IntoTheBlock’s IOMAP model, the recent drop to $56 allowed 270,000 addresses to buy over 5.75 million LTC between $59 and $63. Compared to the overhead resistance, it seems like Litecoin could run all the way to $70 before it finds a considerable supply barrier.
By then, sidelined investors would have likely gotten back into the market, pushing its price even higher and increasing the chances that Gann’s 50% retracement theory would be validated.
Regardless of the bullish outlook based on these technical indicators, investors must be cautious about the dangers posed by breaking below the 50% Fibonacci retracement level. If this support barrier fails to hold, it could trigger a full-fledged bullish to bearish reversal.
Moving Forward
The widespread transmission of coronavirus sparked panic across major economies worldwide, including the cryptocurrency market. As panic spread, over $73 billion was wiped off the total crypto market capitalization. The significant outflow of capital caused most digital assets in the space to plummet, including Ether, XRP, and Litecoin.
However, investors appear to be re-entering the market for various macro-economic reasons. New inflows of cash will be essential for new yearly highs. Time will tell whether the state of commotion in the market will set the stage for the continuation of the bull rally.