
Shutterstock cover by monticello
Fantom Could Retrace Before Making New Highs
Fantom's uptrend has reached a pivotal point that could determine where its price heads next.
Fantom appears ready to undergo a spike in profit-taking among investors. Failing to overcome a critical hurdle could result in a steep correction.
Fantom Hits Make-Or-Break Point
Fantom could be bound for a correction if it fails to breach crucial resistance.
The Proof-of-Stake network’s FTM token has recovered from the recent flash crash that affected most cryptocurrencies in the market. Its price has rebounded by 38.4% in the last 24 hours, going from a low of $2.50 to a high of $3.46.
From a technical perspective, Fantom’s price action appears to have been contained within an ascending parallel channel since Sep. 15.
Every time FTM has risen to this technical formation’s upper boundary since then, the uptrend has reached exhaustion, leading the price to retrace to the pattern’s lower edge. From this point, the price tends to rebound, which is consistent with the characteristics of a parallel channel.
Now, FTM has tested the channel’s upper trendline for the third time in the past three days. Such market behavior suggests that resistance continues to hold, which could lead to rejection. Failing to overcome the $3.95 resistance barrier could result in a correction to the channel’s middle or lower trendline.
These crucial areas of support sit at $2.85 and $2.29.
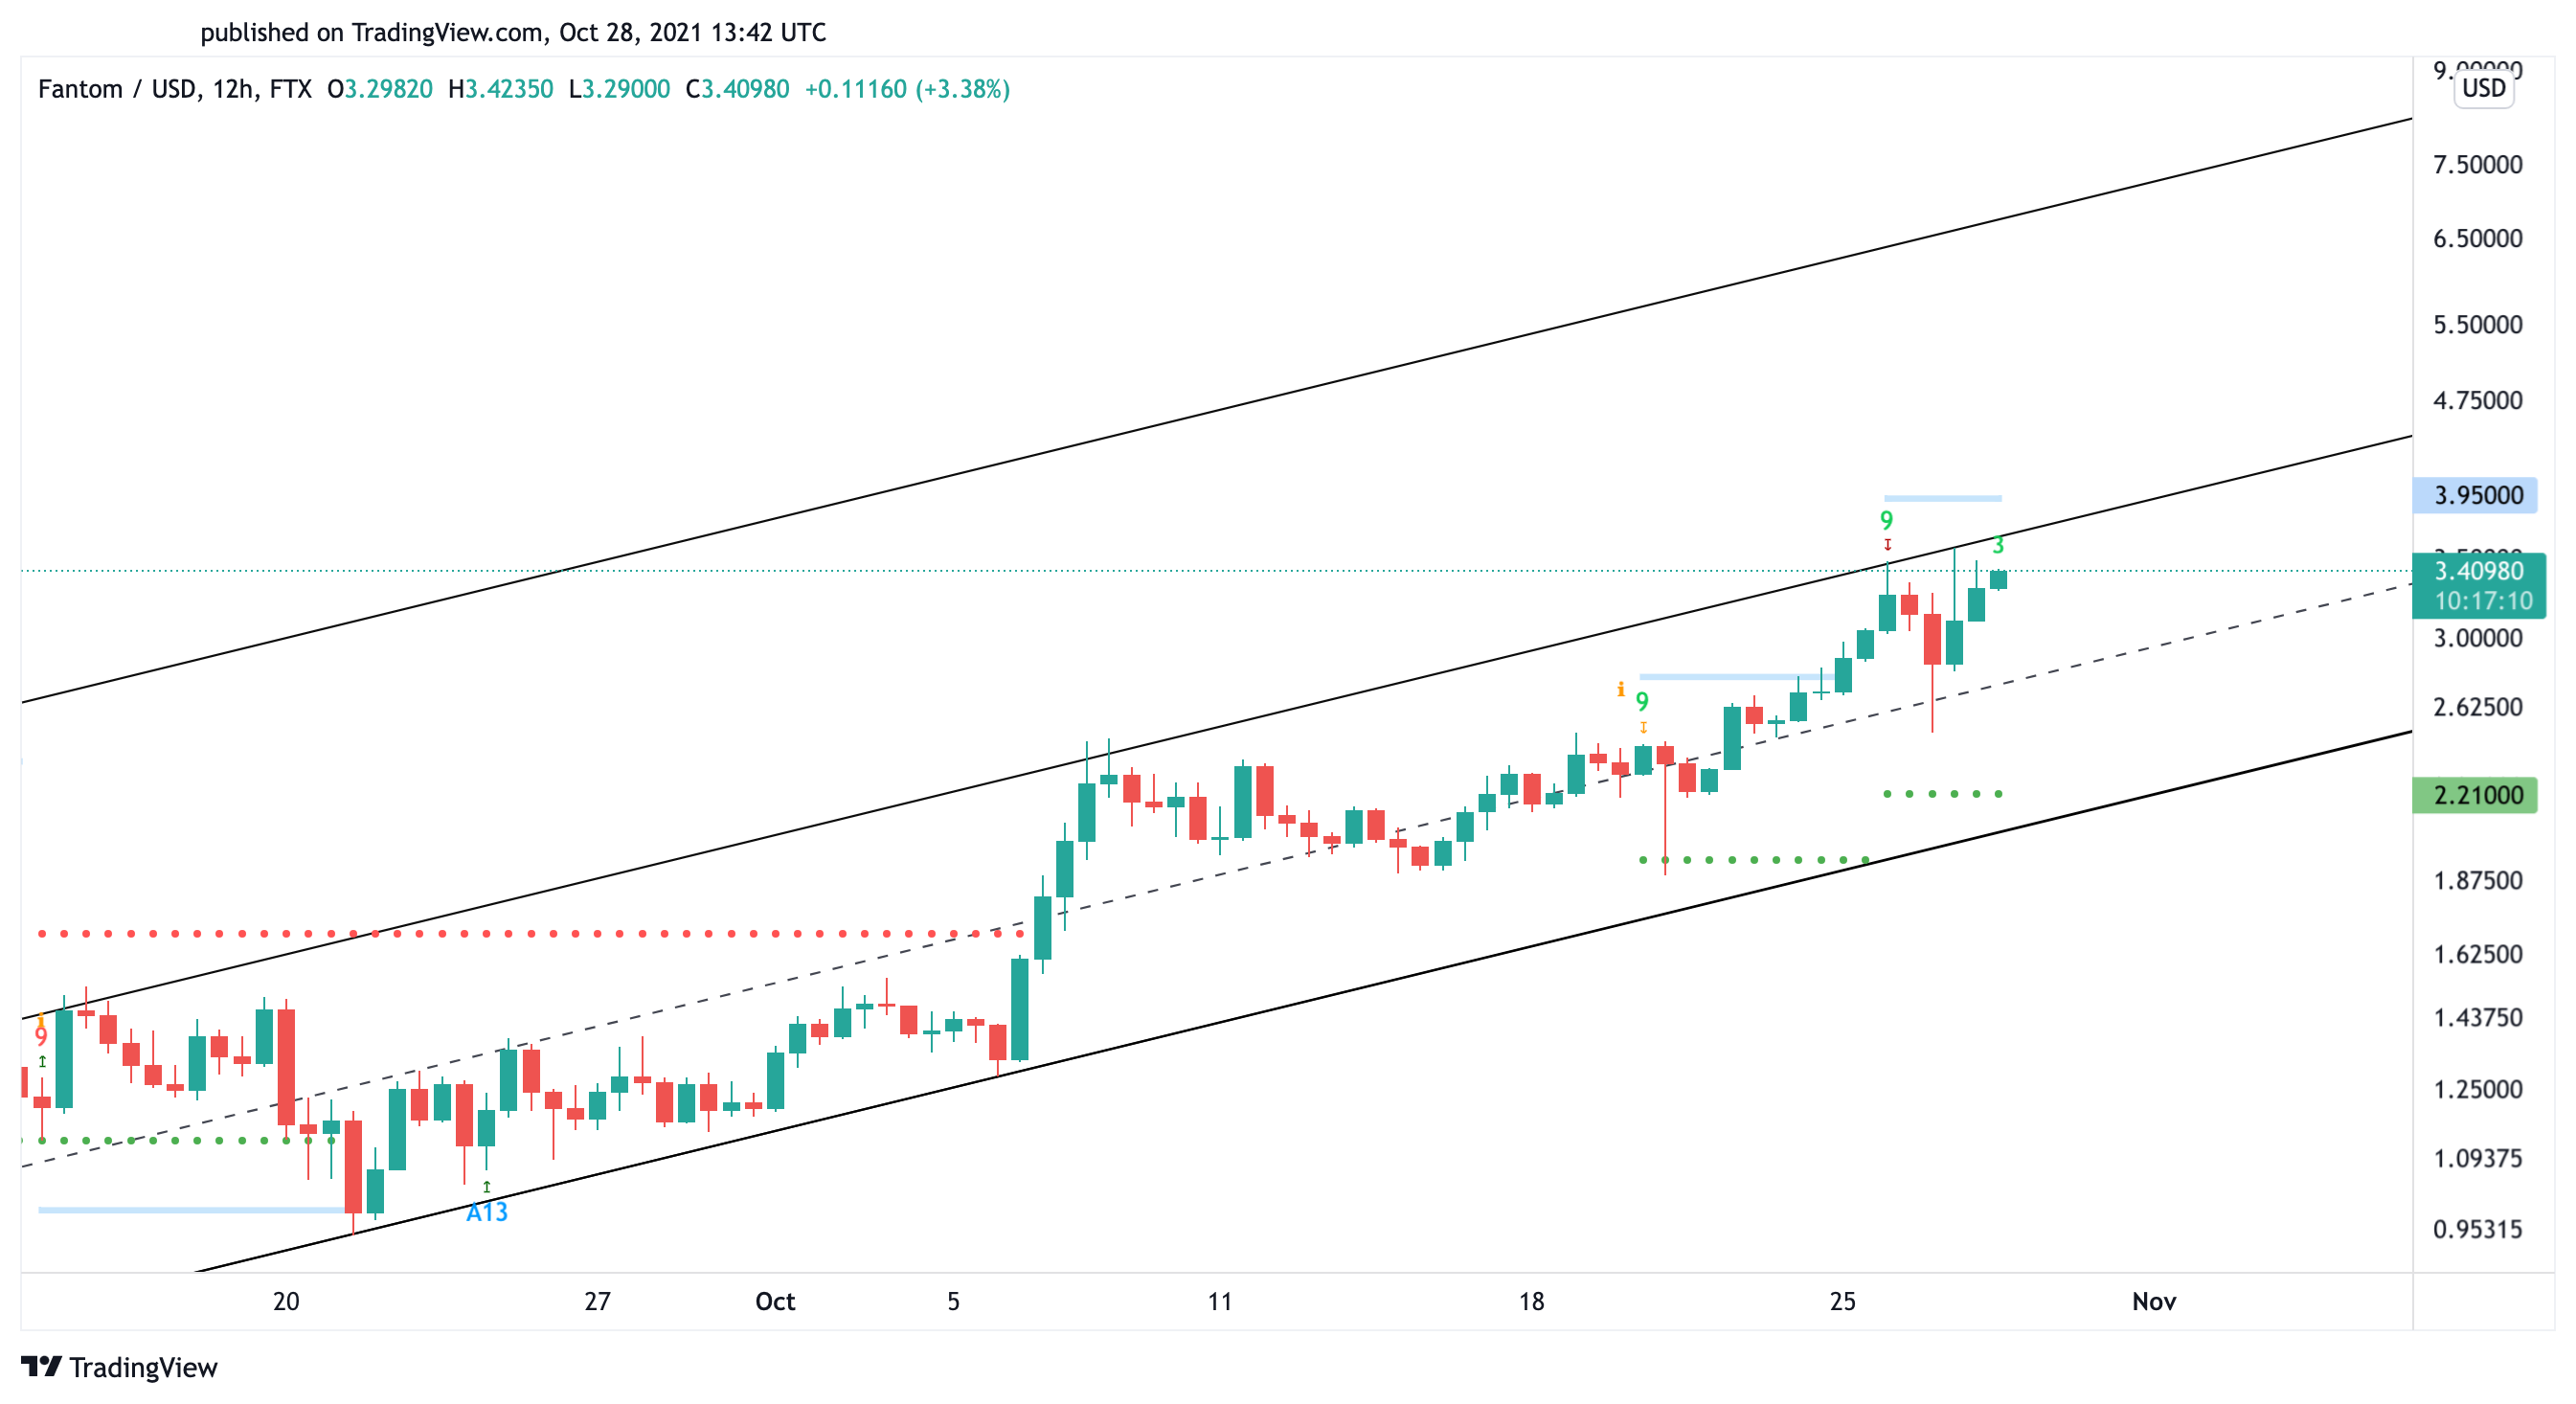
For Fantom to rise to new all-time highs, it must make a decisive close above the channel’s upper boundary at $3.95. Slicing through this hurdle could result in a breakout, sending FTM into an 85% bull rally toward a new all-time high of $7.30. The bullish outlook derives from measuring the channel’s width and adding that distance upward from the breakout point.