
Shutterstock cover by pongpinun traisrisilp
Fantom Flashes Buy Signals After 45% Correction
Fantom’s downtrend could be reaching exhaustion, potentially leading to a bullish impulse.
Fantom appears to be trading in oversold territory while buy signals are starting to appear. However, FTM must hold above a crucial support level to confirm the optimistic outlook.
Fantom Looks Primed to Rebound
Fantom is hinting at a potential recovery after enduring a significant downtrend.
The Layer 1 network’s FTM token has lost more than 45% in market value over the past two weeks. It went from trading at a high of $2.08 on Mar. 2 to hit a low of $1.14 on Mar. 11. Despite the significant losses incurred, one technical indicator suggests that Fantom could be about to reverse.
The Tom DeMark (TD) Sequential indicator is currently presenting buy signals on FTM’s daily and three-day chart. The bullish formations developed as red nine candlesticks, which is indicative of a one to four candlestick upswing or the beginning of a new upward countdown. Bullish momentum must pick up around the current price levels very soon for the optimistic outlooks to be validated.
Fantom is currently trading around a vital support level that has been tested twice since early December 2021. As long as FTM continues to hold around the recent swing low at $1.14, it will have a chance of rebounding. A spike in buy orders at the current price level may give FTM the strength to push toward $1.44 or even $1.73.
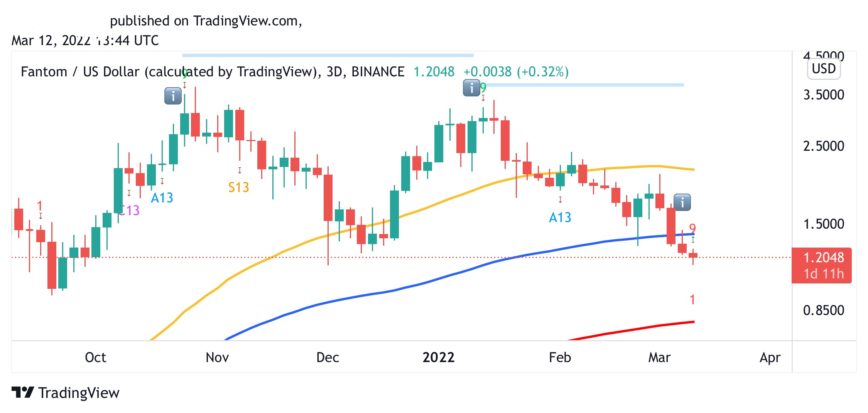
Failing to hold above the $1.14 support level could spell trouble for Fantom. The break of such a critical area of support could induce panic among investors, encouraging them to sell their holdings to avoid further losses. Under such unique circumstances, FTM could see its price drop by nearly 30% toward the 200-day moving average on the three-day chart at $0.80.
Disclosure: At the time of writing, the author of this piece owned BTC and ETH.