Holochain / USD Technical Analysis: Decisive Moment

Share this article
- HOLO retains its short-term bullish bias, although the recent upsurge has lost momentum
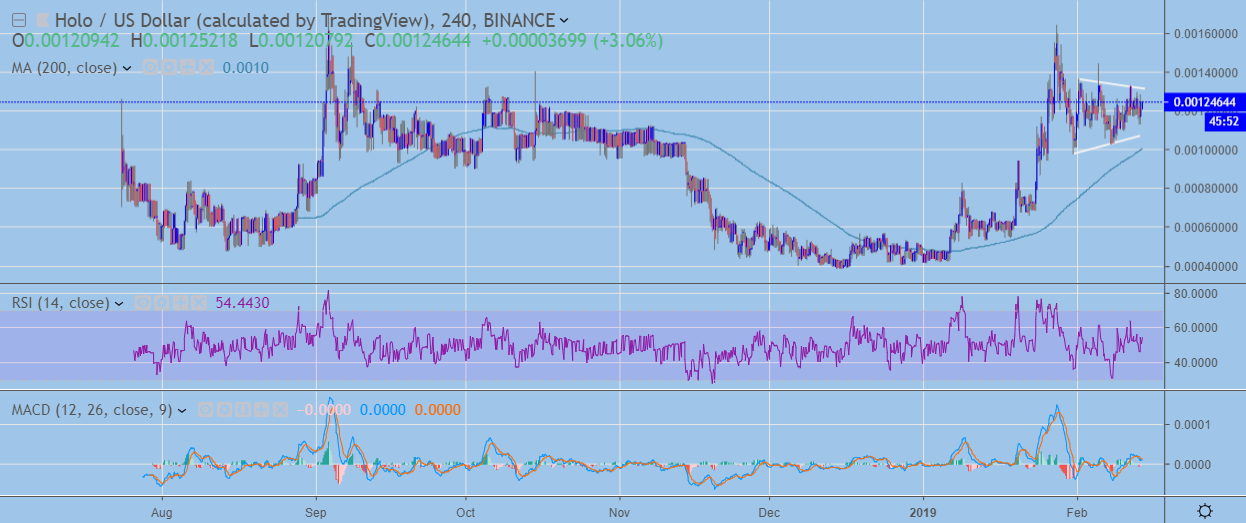
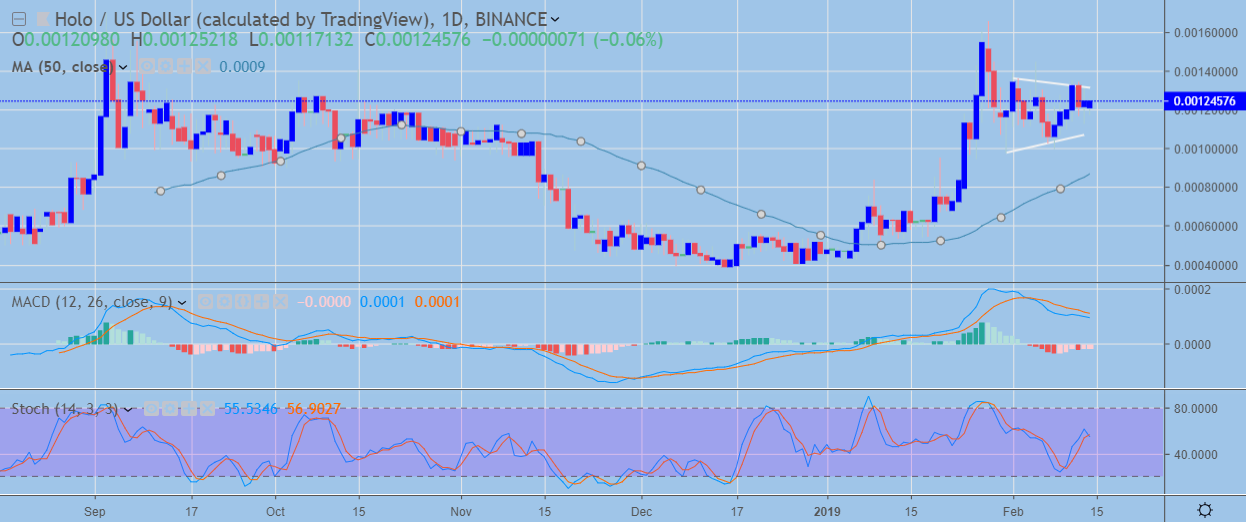
- The four-hour and daily time frames clearly show the HOT / USD pair consolidating inside a neutral triangle pattern
- Medium-term outlook is bullish with a large inverted head and shoulders pattern now present
HOT / USD Short-term price analysis
In the short-term HOLO retains its bullish bias, although price is now consolidating inside a triangle pattern after the recent surge higher in the cryptocurrency started to stall.
The HOT / USD pair risks losing its short-term bullish bias if price slips below the triangle pattern and starts to create bearish lower lows and lower highs.
Technical indicators have turned flat, which is consistent with the range bound trading action currently underway in the pair.

HOT / USD H4 Chart (Source: TradingView)
Pattern Watch
Aside from the neutral triangle pattern on the four-hour time frame, traders should pay close attention to the recently created bullish inverted head and shoulders pattern.
MACD + RSI Indicators
The MACD and RSI indicators both remain flat, as traders await a break from range-bound trading conditions.
HOT / USD Medium-term price analysis
HOLO retains its medium-term bullish bias, although signs are emerging that the pair may retrace lower before we start to see the return of strong buying interest.
The daily time frame strongly mirrors the four-hour time frame, with an inverted head and shoulders pattern clearly present and price consolidating inside a neural triangle pattern.
It appears likely that if buyers fail to rally price above the neckline of the bullish inverted head and shoulders pattern, we are likely to see the HOT / USD pair starting to drift lower and eventually testing towards its 100-day moving average.

HOT / USD Daily Chart (Source: TradingView)
Pattern Watch
The neutral triangle pattern is currently dominating the trading action on the daily time frame.
MACD + RSI Indicators
The MACD indicator continues to correct higher on the daily time frame, although buying interest currently appears fairly limited. The RSI indicator has turned bullish and shows medium-term bulls are still in control of price action.
Conclusion
Traders should watch for a sustained break from the neutral triangle pattern that price is currently trapped inside, as it will indicate the pair’s next directional move.
A bullish breakout will likely provoke a test of the bullish inverted head and shoulders pattern neckline, while a test of the pair’s 100-day moving average is the favored scenario if a bearish breakout occurs.
Decentral Media, Inc., the publisher of Crypto Briefing, is not an investment advisor and does not offer or provide investment advice or other financial advice. Nothing on this website constitutes, or should be relied on as, investment advice or financial advice of any kind. Specifically, none of the information on this website constitutes, or should be relied on as, a suggestion, offer, or other solicitation to engage in, or refrain from engaging in, any purchase, sale, or any other any investment-related activity with respect to any transaction. You should never make an investment decision on an investment based solely on the information on our website, and you should never interpret or otherwise rely on any of the information on this website as investment advice. We strongly recommend that you consult a licensed investment advisor or other qualified financial professional if you are seeking investment advice on an investment.
