IOST Price Analysis IOST / USD: Struggling To Ignite
Bulls are hard at work, but they're running out of time.

Share this article
- IOST has a bullish short-term trading bias, with the cryptocurrency recovering above its 200-period moving average on the four-hour time frame
- The IOST / USD pair has a bullish medium-term outlook, with price still trading well above its 200-day moving average
- Bulls are still struggling to ignite the large inverted head and shoulders pattern on the daily time frame
IOST / USD Short-term price analysis
IOST has a bullish short-term trading bias, with the IOST / USD pair recovering above its key 200-period moving average on the four-hour time frame.
The four-hour time frame is showing that IOST / USD pair is trading within a wedge pattern, with the cryptocurrency failing to move above key trendline resistance.
Technical indicators on the four-hour time frame are bullish and are issuing a buy signal.
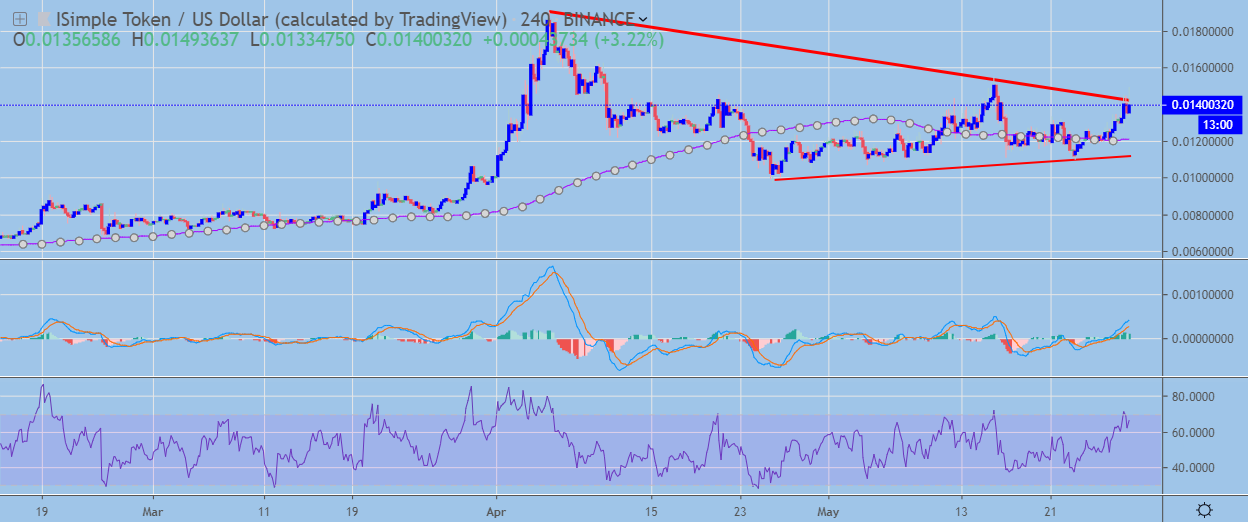 IOST / USD H4 Chart by TradingView
Pattern Watch
Traders should note that the four-hour time frame is also showing a valid head and shoulders pattern.
Relative Strength Index
The RSI indicator on the four-hour time frame is bullish, although it is now approaching overbought territory.
MACD Indicator
The MACD indicator on the four-hour time frame is bullish, with both the MACD signal and histogram issuing buy signals.
IOST / USD Medium-term price analysis
IOST has a bullish medium-term outlook, with the IOST / USD pair still trading above its trend-defining 200-day moving average.
The daily time frame is showing that bulls are struggling to ignite a bullish inverted head and shoulders pattern, which would have a sizeable upside projection.
Technical indicators on the daily time frame have turned bullish and show scope for further upside.
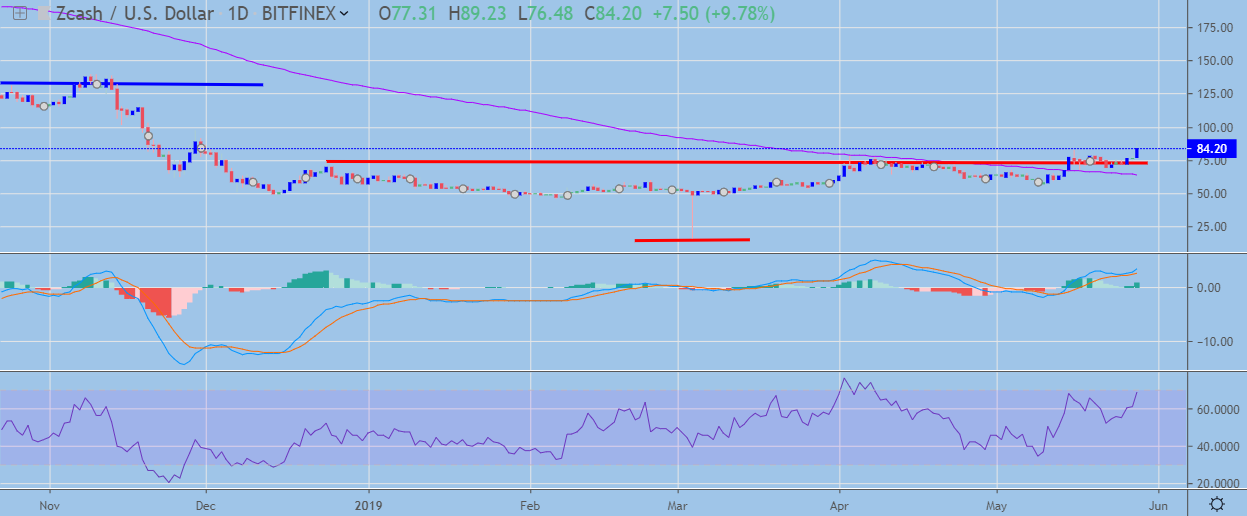 IOST / USD Daily Chart by TradingView
Pattern Watch
Traders should note that if the inverted head and shoulders pattern is triggered the July 2018 trading high is the initial upside target for the IOST / USD pair.
Relative Strength Index
The RSI on the daily time frame has turned bullish and shows scope for further upside.
MACD Indicator
The MACD indicator on the daily time frame is bullish and is currently issuing a buy signal.
Conclusion
IOST is attempting to regain bullish momentum in the short-term as IOST / USD buyers struggle to surpass major trendline resistance on the four-hour time frame.
Medium-term bulls must soon ignite the large bullish pattern on the daily time frame or they risk a much deeper bearish technical correction.
Check out the IOST coin guide.
Share this article
