Litecoin Price Analysis: In Decline
Litecoin is in decline.

Share this article
- Litecoin has a bearish short-term and medium-term trading outlook
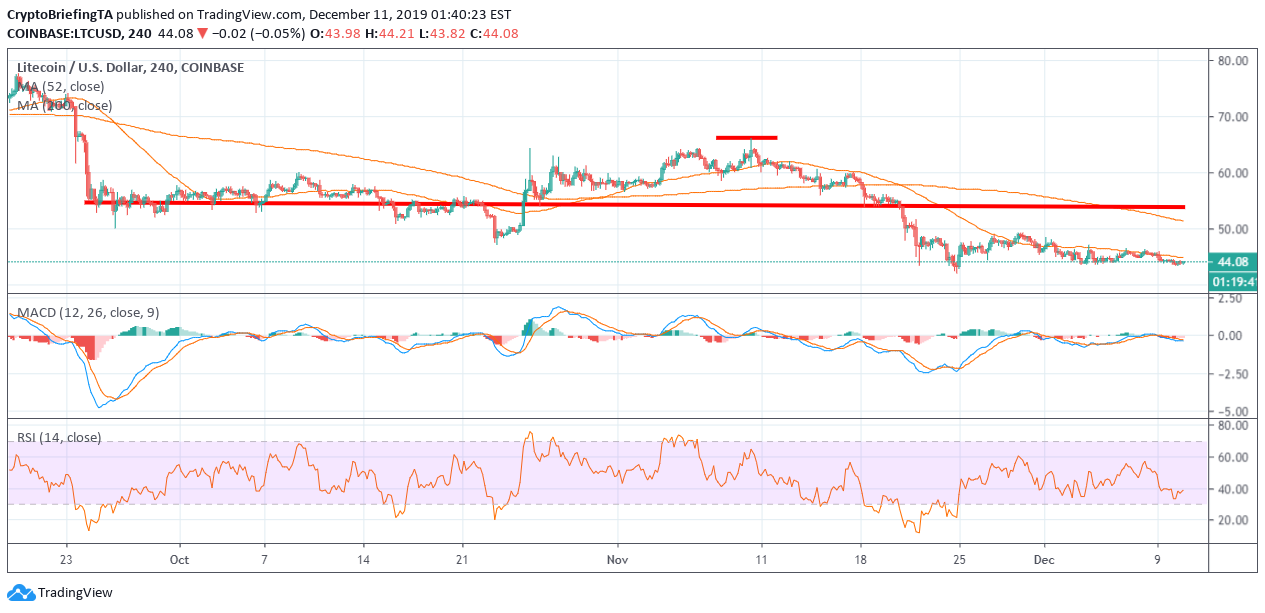
- The four-hour time frame shows that a bearish head and shoulders pattern remains in play
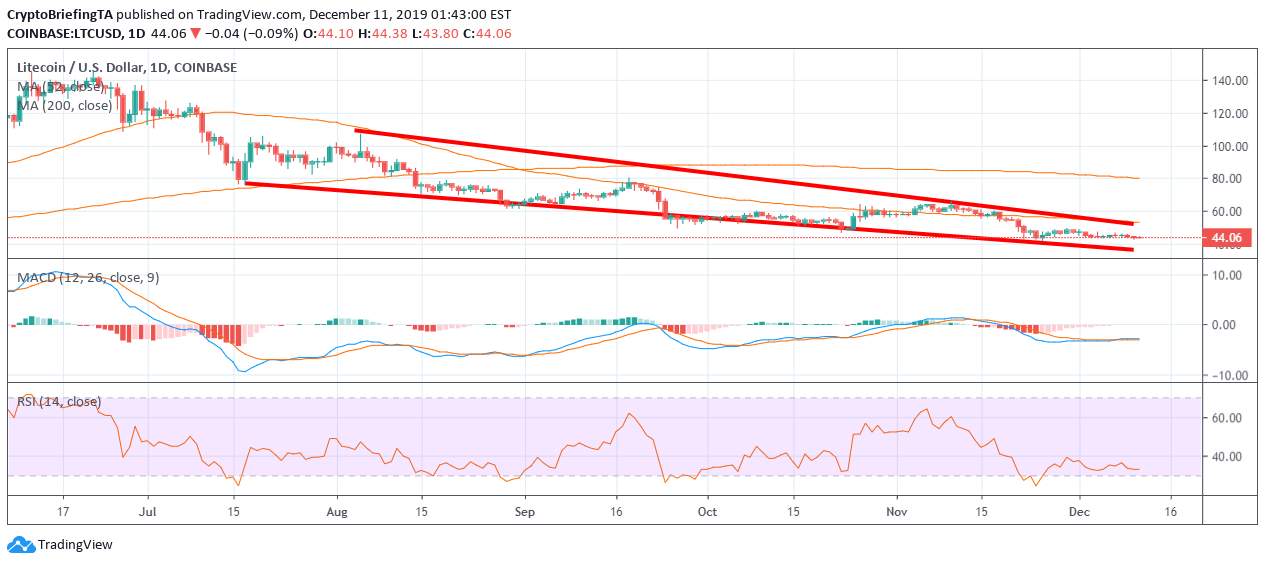
- The daily time frame continues to show a bullish reversal pattern taking shape
Litecoin is coming under increasing technical selling pressure below the $45.00 level after recently been heavily rejected from the psychological $50.00 level.
The LTC/USD pair has been one of the most bearish cryptocurrencies inside the top 10 by market capitalization over the last few months and has lost nearly 70 percent of its value since peaking in late-June.
Technical analysis on the lower time frames shows that the cryptocurrency could suffer a decline towards the $36.00 support level before staging a meaningful recovery.
The four-hour time frame highlights that a large head and shoulders pattern is currently in play, with the overall downside target of the bearish pattern located at the $36.00 level.
The daily time frame offers yet more evidence that the LTC/USD pair may be headed towards the $36.00 level. Price is moving inside large falling wedge pattern, with the bottom of the wedge located around the $36.00 level.
Although the trend is currently heavily bearish, a recovery from the $36.00 level seems possible, as falling wedge patterns are often used as reliable reversal patterns.
According to the size of the wedge pattern, the LTC/USD pair could stage a recovery toward $70.00, if a bullish breakout from the wedge pattern occurs.
Cautious traders may wait for the breakout from the upside of wedge to occur, given the protracted downtrend the LTC/USD pair currently find itself in.
Upside Potential
The four-hour time frame shows that key technical resistance is now located at the $47.00 and $50.00 levels.
Key technical resistance over the medium-term is located at the $57.00 and $70.00 levels.
Downside Potential
The four-hour time frame is showing that the LTC/USD pair has strong medium-term technical support around the $40.00 and $36.00 levels.
Critical long-term technical support for Litecoin is located at $30.00.
Summary
Technical analysis suggests that the LTC/USD pair could see further double-digit declines over the coming days and weeks before it starts to turn higher.
Both the four-hour and daily time frames are showing that the $36.00 level could be a possible area where medium-term bulls may look to enter.
Check out our coin guide for an introduction to Litecoin.
We also wrote a DARE (Digital Asset Report and Evaluation) for the project, analyzing the future prospects of the Bitcoin competitor.
Share this article
